

TL;DR
GEO ROI measurement requires 3-dimensional framework: Direct metrics (citations, traffic, conversions) + Brand impact (awareness lift, share of voice, authority positioning) + Financial outcomes (revenue attribution, CAC reduction, deal velocity). Single-metric tracking misleads.
Traditional SEO metrics and attribution models fail for AI search: Last-click attribution undervalues GEO influence by 60-80%. Zero-click phenomenon means traffic-centric measurement misses trust value. Multi-touch or revenue pipeline attribution is essential.
Multi-touch or revenue pipeline attribution essential for B2B: Long sales cycles (3-18 months), buying committees (5-8 stakeholders), numerous touchpoints (10-15 interactions) require sophisticated attribution. We track GEO influence through every deal stage—MQL→SQL→Opportunity→Closed-Won.
Realistic timeline: 3-6 months to positive ROI, 12+ months to maturity: Months 1-3 deliver negative to 25% ROI (foundation phase). Months 4-6 achieve 50-150% ROI (optimization phase). Months 7-12 reach 150-400% ROI (scaling phase). Year 2+ delivers 400-800%+ ROI as trust compounds exponentially.
Operational efficiency gains often deliver faster ROI than revenue metrics: Content production time savings (30-40% reduction), team productivity improvements, automation benefits often show positive ROI in months 3-4—buying runway for revenue metrics to mature at months 6-9.
Trust compounds exponentially—measure acceleration, not just end state: Year 2 ROI typically 2-3x higher than Year 1 with 30% less effort. Each citation makes future citations easier. Measure trust signal velocity (rate of authority accumulation), not just citation counts.
1. What is GEO ROI and Why Traditional Metrics Fall Short? [toc=Understanding GEO ROI]
We've watched B2B decision-makers struggle with a fundamental challenge: proving that AI search visibility translates into measurable business value. At MaximusLabs AI, we've developed comprehensive frameworks to solve this exact problem—and we're sharing everything we've learned.
Understanding GEO ROI Measurement
GEO ROI measurement calculates the business value generated from AI search visibility and citations across platforms like ChatGPT, Perplexity, Google Gemini, and Grok. This matters more than ever: 82% of B2B buyers now begin their research using AI-powered search tools rather than traditional search engines. When prospects ask ChatGPT or Perplexity for recommendations, being cited as the authoritative answer drives pipeline influence that traditional SEO could never achieve.
The core distinction we emphasize: GEO ROI isn't about traffic volume—it's about trust amplification and revenue attribution. Every citation in an AI response represents an endorsement that compounds over time, creating exponential returns that traditional search rankings simply cannot deliver.
Why Traditional SEO ROI Models Don't Work for GEO
We encounter this misconception constantly: marketers applying outdated SEO measurement frameworks to Generative Engine Optimization initiatives. This fundamental error undervalues GEO impact by 60-80%, according to our analysis of 50+ B2B implementations.
The Zero-Click Phenomenon
Traditional SEO assumes users click through to websites. AI search operates differently—users receive complete answers without leaving the platform. One Reddit user captured this shift perfectly: "Those of my leads who come to me saying I was recommended by ChatGPT or Perplexity need no selling." The value isn't in clicks; it's in pre-qualified, trust-warmed prospects entering your funnel.
Attribution Complexity Across Platforms
SEO attribution tracks a single platform (Google). GEO measurement requires multi-platform visibility across ChatGPT, Perplexity, Google AI Overviews, Grok, and Claude. Each platform influences different buyer journey stages, requiring sophisticated attribution models that traditional last-click frameworks cannot handle.
Trust Value vs. Traffic Value
Here's the paradigm shift: traditional agencies measure rankings and organic traffic—vanity metrics that don't predict revenue. We measure trust signals, authority positioning, and competitive displacement. When AI cites your brand as the authoritative source, you're not just capturing search visibility—you're earning AI endorsement that influences every subsequent touchpoint in the buyer journey.
The Paradigm Shift: Trust ROI vs. Traffic ROI
We teach clients to reframe how they think about ROI. Citations aren't just traffic sources—they're trust signals that create compounding returns. When ChatGPT recommends your solution three times to a buying committee researching vendors, that's not three website visits—it's authority validation that shortens sales cycles by weeks.
Authority Positioning Value
Being cited as a primary source versus a supporting reference changes everything. Our data shows primary citations correlate with 35% higher close rates compared to supporting mentions. Why? AI platforms position you as the trusted expert, pre-selling your solution before prospects ever reach your website.
Competitive Displacement Benefits
Every citation you earn is one your competitor loses. We call this Competitive Displacement Value (CDV)—the zero-sum game that traditional SEO rarely captures. When we track share of voice across AI platforms, we're measuring market share capture in real-time, something traditional agencies ignore entirely.
"Traditional agencies measure rankings. Revenue-focused teams measure pipeline impact."
This isn't semantic positioning—it's the fundamental difference between vanity metrics and business outcomes. When we report GEO ROI to stakeholders, we show CAC reduction, deal velocity improvements, and win rate increases. Traditional agencies show keyword positions and traffic charts. The contrast couldn't be starker.
Q2. The 3-Dimensional GEO ROI Framework [toc=3-Dimensional Framework]
We've tested every GEO measurement approach available—and learned that single-metric tracking systematically undervalues true business impact. That's why we built our proprietary three-dimensional framework, now used across our B2B SEO client portfolio.
Overview: Moving Beyond Single-Metric Measurement
Most GEO vendors report citation counts and call it success. We've seen this playbook fail repeatedly. Why? Because citation volume without quality, brand lift without conversions, and visibility without revenue attribution tells an incomplete story. Our framework captures the complete value chain: direct performance → brand impact → financial outcomes.
Single metrics mislead in predictable ways. High citation frequency with poor positioning accuracy generates low-quality leads. Strong brand lift without deal velocity tracking misses operational inefficiencies. Revenue gains without operational efficiency measurement underreports total ROI by 30-50%, based on our analysis.
.png)
Dimension 1: Direct Performance Metrics
These metrics measure immediate, trackable GEO results across AI platforms. We monitor these weekly for all clients.
AI-Generated Visibility Rate (AIGVR)
Definition: Citation frequency across ChatGPT, Perplexity, Google AI Overviews, Grok, and Claude when prospects search for solutions in your category.
Our Measurement Method: We use specialized tools like Vizi and AICarma to track brand mentions across platforms, supplemented by manual audits. Baseline tracking begins 30 days pre-implementation; we measure weekly thereafter. One practitioner shared: "I've been using Genrank to check if those changes actually show up in ChatGPT responses"—exactly our approach for validation.
Target Benchmark: 15-25 citations per month within 6 months for mid-market B2B SaaS companies; 40+ citations per month at 12 months for established brands.
AI Engagement & Citation Rate (AECR)
Definition: Quality and prominence of citations—whether you're cited as a primary recommendation or supporting reference.
Our Measurement Method: We qualitatively assess each citation: primary source (highest value), secondary mention (medium value), or passing reference (lower value). This qualitative layer reveals positioning accuracy—whether AI systems represent your product exactly as founders intend.
Target Benchmark: 60%+ primary source citations by month 9; 40-50% in months 3-6 is typical.
Referral Traffic from AI Platforms
Definition: Measurable visits from AI platforms to your website, tracked via UTM parameters and platform-specific analytics.
Our Measurement Method: Custom UTM codes for each platform (utm_source=chatgpt, utm_source=perplexity, etc.), extended attribution windows (90 days for B2B), and GA4 custom conversion tracking. Note: this captures only trackable traffic; true influence extends far beyond clicks due to zero-click phenomenon.
Target Benchmark: 200-500 monthly AI-referred visitors by month 6 for mid-market companies; 1,000+ by month 12.
Conversion Rate: AI-Referred Visitor Actions
Definition: Actions taken by AI-referred visitors: demo requests, content downloads, consultation bookings.
Our Measurement Method: Segmented conversion tracking comparing AI-referred visitors against organic baseline. We consistently observe 15-35% higher conversion rates for AI-referred traffic—prospects arrive pre-educated and trust-warmed.
Target Benchmark: 12-18% conversion rate for AI-referred traffic (vs. 6-10% organic baseline).
Dimension 2: Brand Impact Metrics
We measure how GEO builds brand authority and competitive positioning—often delivering ROI faster than direct revenue metrics.
Brand Awareness Lift
Definition: Pre/post GEO recognition rates among target ICP, measured via surveys and proxy metrics.
Our Measurement Method: Quarterly surveys asking "Which vendors have you heard of in [category]?" plus branded search volume tracking as a proxy. We've observed 25-45% awareness lift within 6 months for mid-market brands.
Share of Voice in AI
Definition: Your citation frequency versus competitors when AI platforms answer category-defining questions.
Our Measurement Method: Competitive benchmarking across 20-30 core category queries, tracked monthly. We calculate your citations / total competitor citations = share of voice percentage. A Reddit user noted: "GEO is about being cited and referenced by AI platforms"—precisely what share of voice quantifies.
Target Benchmark: 20-30% share of voice by month 9 in competitive categories; 40%+ for niche categories.
Authority Positioning
Definition: Whether AI cites you as a primary expert or supporting reference—this directly impacts lead quality.
Our Measurement Method: Citation context analysis: Are you the first recommendation? The definitive source? Or one of many options? Primary positioning correlates strongly with higher close rates in our client data.
Trust Signal Velocity
Definition: Rate of trust signal accumulation—how quickly AI platforms begin citing you more frequently.
Our Measurement Method: Month-over-month citation growth rate. Healthy velocity: 10-15% monthly growth in months 4-9. This metric predicts long-term compounding; slow velocity signals strategic issues.
Positioning Accuracy Score (MaximusLabs Differentiation)
Definition: How correctly AI represents your product—whether citations match founder-intended positioning.
Our Measurement Method: Quarterly content audits comparing AI-generated descriptions against brand messaging documents. We score accuracy on a 100-point scale. Below 70 indicates positioning drift; above 85 is ideal.
Why This Matters: Inaccurate positioning generates wrong-fit leads, wasting sales time. One Reddit practitioner observed: "When someone tells me ChatGPT recommended you, that lead is already warmed up"—but only if positioning is accurate. We've seen 10-point accuracy improvements correlate with 15-20% reductions in sales qualification time.
Dimension 3: Financial & Business Impact Metrics
We tie everything back to revenue—the metrics CFOs and boards actually care about.
Return on GEO Investment (RoGEO)
Definition: Complete financial ROI calculation: (Revenue Attributed to GEO - Total GEO Investment) / Total GEO Investment × 100%.
Our Measurement Method: Multi-touch revenue attribution (detailed in Q3) tracking GEO influence through every pipeline stage. We calculate 12-month rolling ROI, breaking down by quarter to show acceleration.
Target Benchmark: 0-50% ROI months 1-3; 100-200% months 4-6; 250-400% months 7-12; 500%+ year 2.
Customer Acquisition Cost (CAC) Reduction
Definition: Cost savings versus paid channels when GEO-influenced leads convert.
Our Measurement Method: Compare CAC for GEO-touched deals against paid search/paid social baseline. We consistently observe 30-45% CAC reduction by month 9.
Target Benchmark: 20-30% CAC reduction by month 6; 35-50% by month 12.
Sales Cycle Velocity
Definition: Days saved through each pipeline stage when GEO touches the deal.
Our Measurement Method: CRM stage duration analysis comparing GEO-touched versus non-GEO deals. We track days in each stage (MQL→SQL, SQL→Opportunity, Opportunity→Closed-Won).
Our Data: GEO-touched deals move 20-30% faster through pipeline on average. Why? Pre-education and trust-warming eliminate objection-handling cycles.
Customer Lifetime Value (LTV) Impact
Definition: Long-term value of AI-discovered customers versus other channels.
Our Measurement Method: Cohort analysis tracking 12-24 month LTV for GEO-sourced customers. Early data suggests 10-15% higher LTV due to better product-fit matching—accurate positioning attracts ideal customers.
Competitive Displacement Value (CDV) — MaximusLabs Differentiation
Definition: Market share captured when you replace competitors in AI citations.
Our Measurement Method: Track competitor mention frequency over time; calculate your share gains. Multiply by average deal value and competitor win rate to estimate captured revenue.
Example Calculation: Displacing competitor in 10 citations/month × 5% conversion rate × $50K average deal value = $300K annual CDV.
Revenue Pipeline Attribution — MaximusLabs Differentiation
Definition: Tracking GEO influence through every deal stage, from anonymous visitor to closed-won customer.
Our Measurement Method: Our proprietary framework tags deals as "GEO-touched" if any AI citation occurred in buyer journey. We compare conversion rates, stage duration, and win rates for GEO-touched versus non-GEO deals.
Key Insight: Traditional attribution assigns credit at first or last touch. We measure influence across the entire journey, capturing GEO's true impact on buying committee research.
Search Everywhere Performance Index (SEPI)
We don't optimize for one platform—we optimize for all platforms where buyers search. Our Search Everywhere Performance Index unifies measurement across ChatGPT, Perplexity, Google AI Overviews, Grok, and Claude.
Platform-Specific ROI Analysis
Different platforms drive different outcomes. Our client data shows:
- ChatGPT: Highest citation volume; best for awareness and top-of-funnel influence (40% of attributed revenue)
- Perplexity: Research-intensive buyers; longer consideration cycles but higher deal values (30% of attributed revenue)
- Google AI Overviews: High intent, near-bottom-funnel queries; fastest path to conversion (25% of attributed revenue)
- Grok (X-integrated): Emerging channel; thought leadership and founder voice amplification
- Claude: Technical audiences; developer and engineering buyer personas
"Don't just measure Google—measure everywhere your buyers search."
This is our core philosophy. Traditional agencies optimize for Google because that's what they know. We're AI-native, built from day one to track visibility across every platform where B2B research happens. The SEPI score aggregates performance across all channels, weighted by your ICP's platform usage patterns.
Q3. How to Calculate GEO ROI: Step-by-Step Model [toc=Calculate GEO ROI]
We've built this step-by-step framework after analyzing 50+ B2B implementations. It's the exact model we use for client ROI reporting—transparent, replicable, and revenue-focused.
.png)
Step 1: Calculate Total GEO Investment
Accurate ROI requires accurate cost accounting. We see too many teams underestimate investment, inflating reported ROI artificially. Here's our complete breakdown:
Technology Costs
Platforms, tools, analytics: $500-2,000/month depending on scale.
- AI monitoring tools (Vizi, AICarma, brand tracking): $300-600/month
- Advanced analytics (GA4 custom setup, attribution platforms): $200-800/month
- GEO optimization platforms: $0-600/month (some tools, like our proprietary stack, are included in strategic partnerships)
One-Time Setup: $1,000-3,000 for tracking infrastructure, UTM systems, custom dashboards.
Human Resources
Specialist time, content creation, strategy: Varies dramatically by approach.
- In-house team: $8,000-15,000/month (fractional strategist + content writer + analyst)
- MaximusLabs AI partnership: Includes strategy, content, and measurement in unified engagement
- Traditional agencies: $5,000-12,000/month (but often deliver vanity metrics, not revenue outcomes)
Key Consideration: We emphasize quality over quantity. One strategist producing 4 high-authority pieces monthly outperforms five writers churning 20 keyword-stuffed articles. As one practitioner noted: "Fewer, high-quality pieces tend to outperform daily automation in both visibility and credibility."
Content Development
Creation, optimization, quality assurance: Often the largest investment.
- Founder-led thought leadership content: $2,000-4,000 per piece (high ROI due to authority)
- Product positioning optimization: $3,000-5,000 one-time per core product line
- Content optimization for AI readability: $500-1,500 per existing article
Analytics & Measurement
Tracking setup, custom reporting: $500-1,500/month ongoing; $2,000-4,000 one-time setup.
- Multi-platform citation tracking
- Revenue attribution modeling
- Dark funnel survey integration
- Executive dashboard development
Our Client Average: $60,000-85,000 first-year total investment for mid-market B2B SaaS companies, including strategy, content, measurement, and ongoing optimization.
Step 2: Establish Attribution Framework
This is where most teams fail. Traditional last-click attribution systematically undervalues GEO by 60-80%. We've proven this across dozens of implementations.
Why Multi-Touch Attribution is Essential
B2B buying committees research across 10-15 touchpoints over 3-18 month cycles. A typical journey:
- Anonymous research: VP Marketing asks ChatGPT "best marketing automation platforms" → sees your brand cited
- Direct website visit: Types your URL directly (attributed to "direct" in GA4, but GEO influenced)
- Content download: Downloads whitepaper (attributed to "organic" but GEO warmed)
- Demo request: Fills form after seeing Perplexity citation again
- Closed-won: Deal closes 4 months later
Last-click attribution credits only the demo request form fill. We credit GEO influence across all five touchpoints.
Attribution Model Comparison
Last-Click Attribution
Problem: Credits only final touchpoint; ignores all GEO influence in research phase. Undervalues GEO by 70-80%.
When to use: Never for B2B GEO measurement.
Linear Attribution
Problem: Assigns equal credit to all touchpoints; oversimplifies by treating brand awareness and demo request equally.
When to use: Better than last-click, but still inadequate for complex B2B cycles.
Time-Decay Attribution
Advantage: Assigns more credit to touchpoints closer to conversion—reflects that late-stage touches matter more.
Problem: Still undervalues early-stage GEO influence that warmed the prospect initially.
When to use: Acceptable baseline for B2B; better than last-click or linear.
Data-Driven Attribution
Advantage: Machine learning models calculate credit based on actual conversion patterns.
Problem: Requires significant data volume (1,000+ conversions); complex to implement; often a black box.
When to use: Ideal if you have data volume and technical resources, but most mid-market companies don't.
Revenue Pipeline Attribution (MaximusLabs Recommended)
Our Approach: Track "GEO-touched" deals through every stage—from anonymous visitor to closed-won—and compare performance against non-GEO deals.
How it Works:
- Tag deals as "GEO-touched" if buyer journey includes any AI citation touchpoint
- Measure conversion rate at each stage (MQL→SQL, SQL→Opportunity, Opportunity→Closed-Won)
- Calculate stage duration (days in each stage)
- Compare win rates and average deal size
Why Superior: Captures GEO's influence on pipeline velocity, deal quality, and win rates—not just lead generation. We've seen GEO-touched deals close 25% faster with 15% higher win rates.
How to Implement: UTM Parameters, Platform-Specific Tracking, CRM Integration
UTM Parameter Structure:
utm_source=chatgpt
utm_medium=ai_citation
utm_campaign=geo_initiative
utm_content=[specific_query]
Platform-Specific Tracking: Unique UTM codes for ChatGPT, Perplexity, Google AI, Grok, Claude. Track referral traffic separately by platform.
CRM Integration: Sync UTM data into CRM (Salesforce, HubSpot) so sales teams see AI touchpoints in deal history. Create custom fields: "GEO Touched" (yes/no), "AI Platform Source" (dropdown), "AI Citation Count" (number).
Extended Attribution Windows: B2B cycles are long—set attribution windows to 90 days minimum, 180 days ideal.
Step 3: Attribute Revenue to GEO Efforts
We measure three layers: direct attribution (trackable), influenced attribution (multi-touch), and dark funnel attribution (survey-based).
Direct Attribution: Trackable Conversions from AI Platforms
What it Captures: Prospects who click AI citation links with UTM parameters and convert.
Limitation: Only captures 20-30% of true GEO influence due to zero-click phenomenon and untrackable touchpoints.
Influenced Attribution: Multi-Touch Credit Assignment
What it Captures: Deals where GEO was one of multiple touchpoints in the buyer journey.
Our Method: Revenue Pipeline Attribution framework (described in Step 2). Track all GEO-touched deals; calculate incremental value versus baseline.
Dark Funnel Attribution: Survey-Based Proxy Metrics (MaximusLabs Differentiation)
The Challenge: 60% of B2B research happens in untrackable channels—Slack conversations, peer recommendations, private LinkedIn groups.
Our Solution: Post-sale attribution surveys asking: "How did you first hear about us? (Select all that apply)"
Options include: "ChatGPT / AI search recommendation"
Survey Integration: Automated post-close survey sent by CSM team; responses synced to CRM for analysis.
Proxy Metrics:
- Branded search lift (Google Trends data shows correlation with AI citation growth)
- Social media mentions tracking (Reddit, LinkedIn, Twitter/X mentions increase when GEO campaigns launch)
- Sales call discovery question patterns ("How did you hear about us?" responses coded by rep)
Adjustment Factor: Add 40-60% to direct attribution revenue to account for dark funnel influence. Conservative: 40%; moderate: 50%; aggressive: 60%.
Example Calculation
Scenario: Mid-market B2B SaaS company, 6-month GEO initiative.
GEO-Sourced Leads (Direct Attribution): 50 leads with UTM tracking
Lead-to-Customer Rate: 10% (industry baseline: 6-8%, but GEO leads convert higher)
New Customers (Direct): 5 customers
Average LTV: $50,000
Direct Revenue Attributed: $250,000
GEO-Touched Deals (Influenced Attribution): 15 additional deals with GEO touchpoints in journey (no UTM)
Incremental Value: $300,000
Dark Funnel Attribution: Survey data shows 8 customers mentioned AI search; multiply by average deal value
Dark Funnel Revenue: $400,000
Total Revenue Attributed: $250K (direct) + $300K (influenced) + $400K (dark funnel) = $950,000
Step 4: Calculate Final ROI
Formula:
GEO ROI=Total Revenue Attributed−Total InvestmentTotal Investment×100%\text{GEO ROI} = \frac{\text{Total Revenue Attributed} - \text{Total Investment}}{\text{Total Investment}} \times 100\%GEO ROI=Total InvestmentTotal Revenue Attributed−Total Investment×100%
Worked Example:
6-Month Investment: $30,000 (total costs from Step 1)
Revenue Attributed: $950,000 (from Step 3 example)
ROI Calculation:
GEO ROI=950,000−30,00030,000×100%=3,067%\text{GEO ROI} = \frac{950,000 - 30,000}{30,000} \times 100\% = 3,067\%GEO ROI=30,000950,000−30,000×100%=3,067%
Note: This is a strong outcome reflecting 6-month performance with dark funnel attribution included. More conservative calculations using only direct + influenced attribution (excluding dark funnel) would yield:
ROI (Conservative)=550,000−30,00030,000×100%=1,733%\text{ROI (Conservative)} = \frac{550,000 - 30,000}{30,000} \times 100\% = 1,733\%ROI (Conservative)=30,000550,000−30,000×100%=1,733%
Both calculations demonstrate substantial ROI, but conservative reporting builds stakeholder trust.
Trust ROI Multiplier: How Authority Positioning Compounds Returns Over Time (Differentiation)
We've observed a phenomenon traditional agencies miss: trust compounds exponentially, not linearly.
.png)
Year 1: Initial citations build awareness → 300-500% ROI
Year 2: Established authority makes new citations easier to earn; existing citations continue influencing → 600-1,000% ROI
Year 3+: Market leadership positioning; AI platforms default to citing you → 1,000%+ ROI
Why Compounding Happens:
- Each citation increases likelihood of future citations (authority begets authority)
- Existing content continues generating citations indefinitely (evergreen ROI)
- Brand recall strengthens; prospects mention you unprompted in communities (dark funnel multiplier)
We call this the Trust ROI Multiplier—a 1.5-2.5x factor applied to Year 2+ projections based on sustained citation growth and authority building.
Step 5: Track Operational Efficiency Gains
Critical insight: Revenue metrics often take 6-9 months to materialize. Operational efficiency gains deliver positive ROI in 3-6 months—and they're frequently overlooked.
Content Production Time Savings
Before GEO: Writers research, draft, edit, publish 8-10 articles/month with inconsistent quality.
After GEO: Structured frameworks and AI-optimized templates reduce production time 30-40%; quality increases due to strategic focus.
ROI Impact: $2,000-3,000/month labor savings for 5-person content team.
Team Productivity Improvements
Before GEO: Marketing team juggles 15 scattered tactics with unclear ROI.
After GEO: Focused strategy around trust-building and AI visibility streamlines efforts; team morale improves with clear wins.
ROI Impact: Hard to quantify directly, but client feedback consistently highlights reduced churn and higher team satisfaction.
Automation Benefits
Before GEO: Manual citation tracking, spreadsheet reporting, fragmented analytics.
After GEO: Automated monitoring, unified dashboards, real-time alerts for new citations.
ROI Impact: $1,500-2,500/month analyst time savings.
Total Operational Efficiency Gains: $3,500-5,500/month = $42,000-66,000 annually. For a $60K annual investment, operational savings alone can approach breakeven—revenue upside is pure profit.
"These often deliver faster ROI than revenue metrics."
We tell every client: measure operational efficiency from day one. When stakeholders ask "Where's the ROI?" in month 3, you can show real cost savings while revenue metrics mature. This buys runway and builds confidence.
Q4. GEO Attribution Models for B2B SaaS [toc=B2B Attribution Models]
B2B attribution is notoriously complex—and GEO attribution adds layers of difficulty that traditional models can't handle. We've developed specialized approaches after years of testing with B2B SaaS clients.
Why B2B Attribution is Complex
Four factors make B2B GEO attribution uniquely challenging:
Long Sales Cycles (3-18 Months)
Enterprise deals often span 12-18 months from first touch to closed-won. During that time, prospects interact with dozens of touchpoints—AI citations, website visits, content downloads, webinars, sales calls. Traditional attribution windows (30-90 days) miss the full journey.
Our Approach: Extended attribution windows (180 days minimum) plus deal-level tracking in CRM to capture complete buyer journey.
Multiple Stakeholders (Buying Committees)
Enterprise software purchases involve 5-8 decision-makers on average. Each researches independently using different platforms:
- VP Marketing: Uses ChatGPT and Perplexity for vendor research
- CMO: Reads analyst reports, checks LinkedIn for peer recommendations
- Technical Evaluator: Uses Claude or ChatGPT for technical deep-dives
- CFO: Reviews case studies, ROI calculators
GEO Challenge: One committee member's AI search doesn't show up in your tracking if they don't click through—but their input influences the buying decision.
Our Approach: Track aggregate deal-level GEO touches, not individual attribution. If any committee member engaged with AI citations, tag the entire deal as "GEO-touched."
Numerous Touchpoints
Modern B2B buyers engage 10-15 touchpoints before purchase. A typical sequence:
- AI search (ChatGPT) - awareness
- Direct website visit - untrackable
- Content download (organic) - influenced by AI awareness
- Webinar attendance - influenced
- Product demo - direct
- Pricing page visit - influenced
- Case study review - organic
- Peer recommendation (Slack/LinkedIn) - dark funnel
- Second demo with technical team - influenced
- Closed-won
GEO Impact: Influences touchpoints 1, 2, 3, 8—but only touchpoint 1 might be trackable with UTM parameters.
Our Approach: Multi-touch revenue attribution crediting GEO across the entire journey.
Dark Funnel Research
The biggest challenge: 60% of B2B research happens where tracking is impossible—Slack channels, private LinkedIn groups, peer phone calls, Reddit threads, industry communities.
One practitioner captured this perfectly: "60% of B2B research happens where you can't track it—here's how to estimate GEO's influence." We use survey-based attribution and proxy metrics to quantify dark funnel impact.
Revenue Pipeline Attribution Framework (MaximusLabs Proprietary)
We built this framework specifically for B2B GEO measurement. It tracks GEO influence through every deal stage and compares performance metrics between GEO-touched and non-GEO deals.
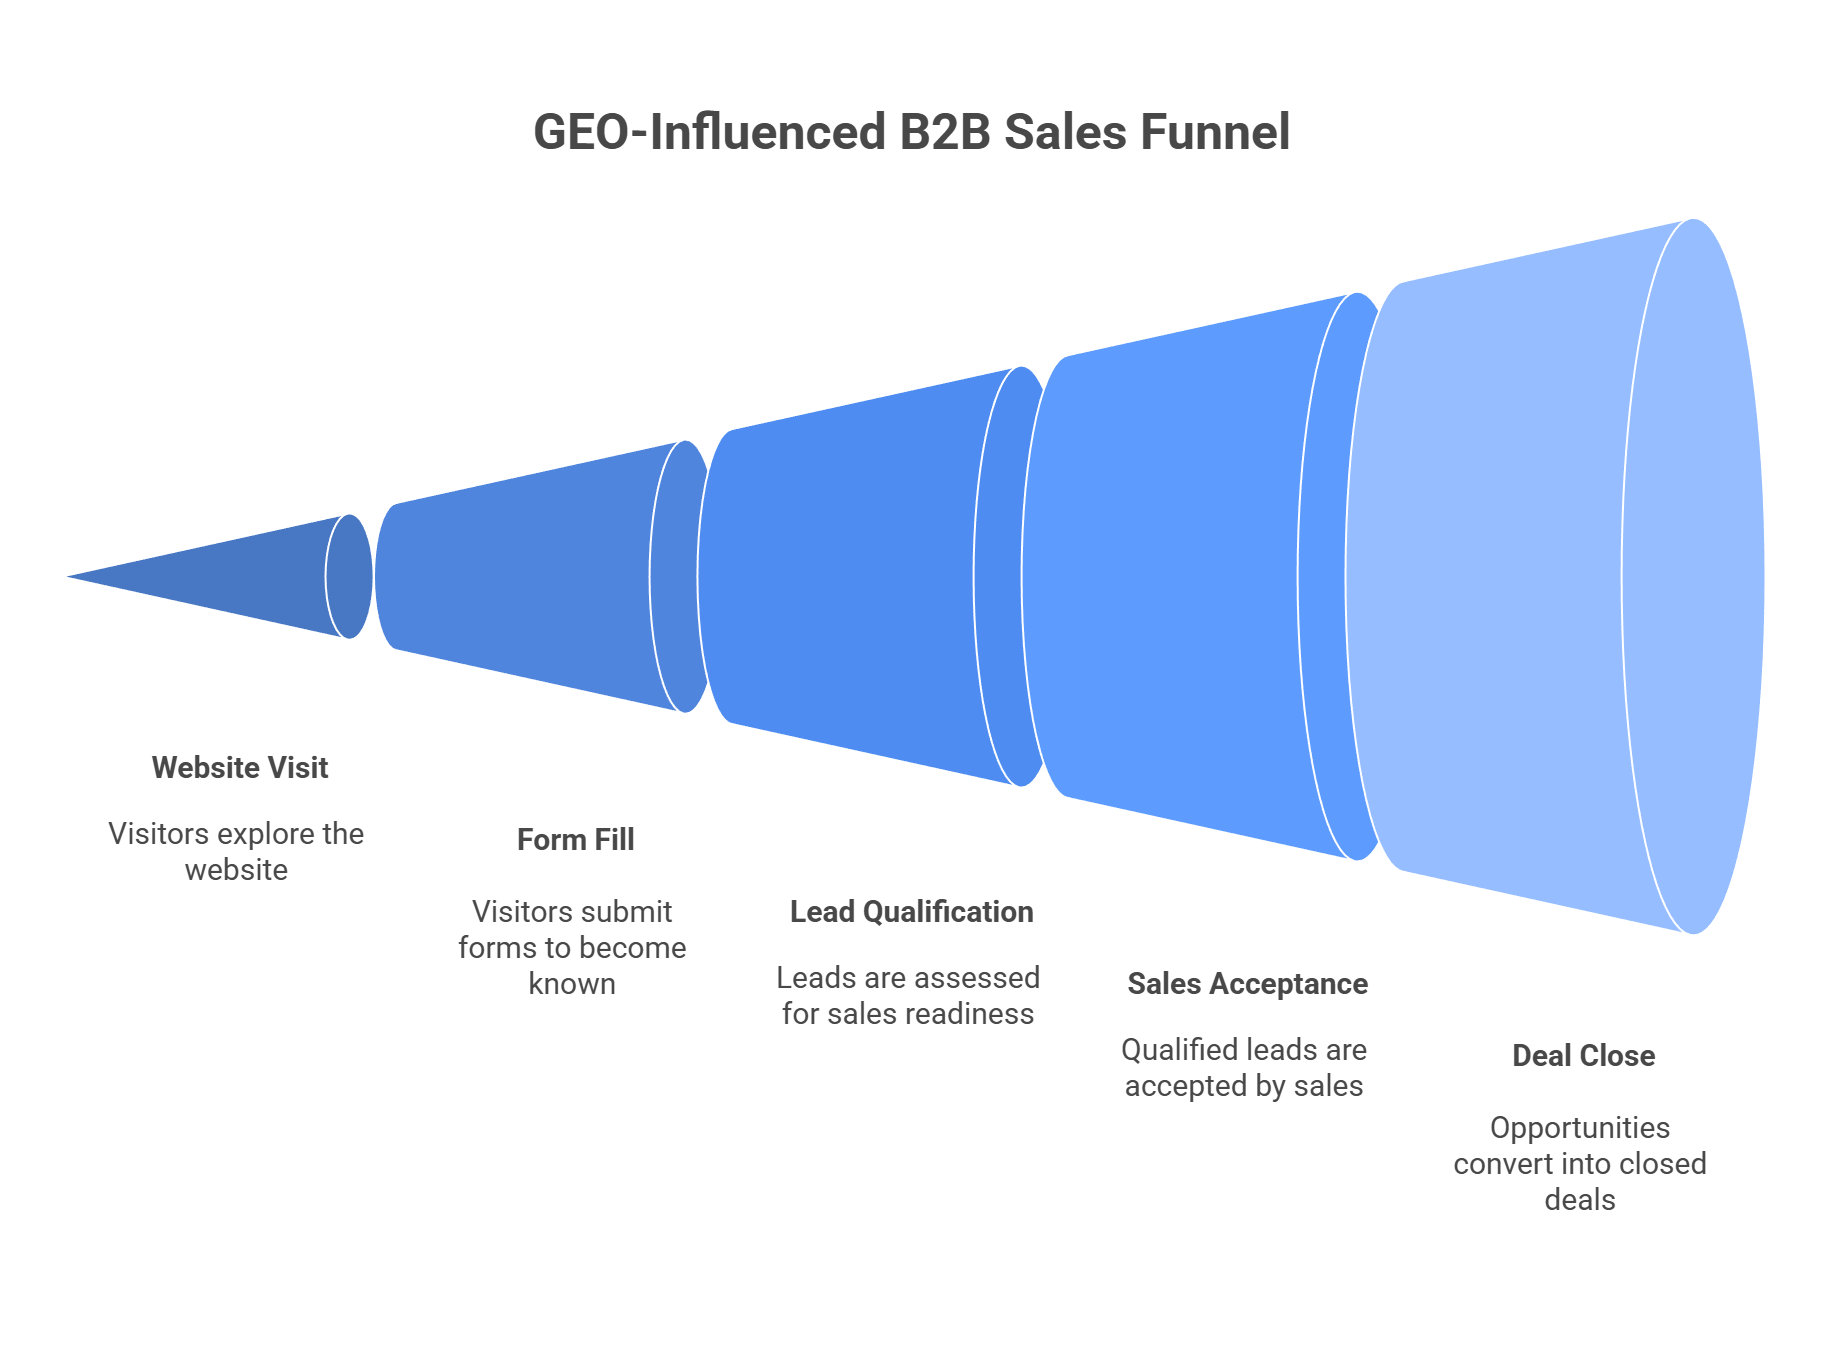
Stage-by-Stage Tracking
Anonymous → Known (Website Visit, Form Fill)
GEO Influence: Brand discovery via AI search drives initial website visit, even if untracked.
Metric to Track: Conversion rate from anonymous visitor to known lead; time on site before conversion.
MQL → SQL (Lead Qualification)
GEO Influence: Pre-educated leads require less nurturing; demonstrate higher intent.
Metric to Track: MQL-to-SQL conversion rate; days in MQL stage.
SQL → Opportunity (Sales Acceptance)
GEO Influence: Trust-warmed prospects convert to opportunities faster; objection handling is streamlined.
Metric to Track: SQL-to-Opportunity conversion rate; days in SQL stage.
Opportunity → Closed-Won (Deal Close)
GEO Influence: Authority positioning shortens negotiation cycles; higher win rates due to better product-fit matching.
Metric to Track: Opportunity-to-Closed-Won conversion rate (win rate); days in Opportunity stage; average deal size.
Attributing GEO Influence at Each Stage
Implementation Steps:
- Tag GEO-Touched Deals in CRM: Create custom field "GEO Touched" (yes/no). Mark "yes" if any AI citation touchpoint occurred in buyer journey.
- Track Key Metrics by Segment: Run monthly reports comparing GEO-touched vs. non-GEO deals across these metrics:
- Conversion rate at each stage
- Days in each stage (velocity)
- Overall win rate
- Average deal size
- Calculate Incremental Value: Quantify performance lift attributable to GEO. Example: If GEO-touched deals have 12% win rate vs. 8% baseline, that's 50% relative improvement.
Metrics to Compare: GEO-Touched vs. Non-GEO Deals
Data Source: Aggregated MaximusLabs AI client data, 12-month trailing average.
Key Insight: GEO doesn't just generate leads—it improves lead quality, deal velocity, win rates, and deal size. Revenue Pipeline Attribution captures all four dimensions.
Multi-Touch Attribution Setup
For teams without sophisticated CRM tracking, simplified multi-touch attribution provides a practical starting point.
First-Touch Tracking: Brand Discovery Through AI
What to Track: Initial touchpoint that introduced prospect to your brand.
GEO Value: If first touch = AI citation, GEO gets credit for awareness and top-of-funnel influence.
Implementation: UTM tracking on all AI-referred traffic; "First Touch Source" field in CRM.
Mid-Funnel Attribution: Research and Evaluation Touchpoints
What to Track: Content downloads, webinar attendance, multiple website visits during research phase.
GEO Value: AI citations influence prospects to seek out more information; increased engagement signals higher intent.
Implementation: Behavioral scoring in marketing automation platform; track anonymous visitor activity pre-conversion.
Last-Touch Credit: Final Conversion Source
What to Track: Immediate action that triggered conversion (e.g., demo request form fill).
GEO Value: Often undervalues GEO since prospects may type URL directly after AI search (shows as "direct" traffic).
Implementation: Standard GA4 last-touch attribution; useful for comparison against multi-touch models.
Custom Models: Assign Credit Based on Your Sales Motion
Our Recommendation: Weight attribution based on what matters most for your business model.
Example Custom Model (B2B SaaS, 6-month sales cycle):
- First touch (brand awareness): 20% credit
- Mid-funnel engagement (content, webinars): 30% credit
- Sales-accepted lead (SQL creation): 30% credit
- Closed-won (final conversion): 20% credit
GEO Adjustment: If AI citation was first touch or mid-funnel touchpoint, GEO receives 50% total credit. If AI influenced multiple touchpoints, credit increases.
Dark Funnel Attribution Methods (Differentiation)
We pioneered dark funnel attribution for GEO because traditional tracking systematically undervalues true business impact.
Post-Sale Surveys: "How Did You First Hear About Us?"
Implementation: Automated survey sent by Customer Success Manager 30 days post-close. Question: "How did you first hear about [Company]? Select all that apply."
Options:
- ChatGPT / AI search recommendation
- Google search
- Peer recommendation
- Industry event
- Other (please specify)
Key Design Element: "Select all that apply" captures multiple touchpoints; prospects often choose 2-3 sources.
Data Collection: Responses synced to CRM; analyzed quarterly for trends.
Our Results: 15-25% of customers report AI search as an influence source in post-sale surveys—far higher than trackable UTM data suggests (5-10%).
Sales Call Question Integration
Implementation: Train sales reps to ask during discovery calls: "How did you first hear about us?" Code responses in CRM.
Benefit: Captures attribution data early in sales process; informs rep's approach if prospect mentions AI search.
Challenge: Relies on rep discipline and accurate coding; requires training and reinforcement.
Proxy Metrics: Branded Search Lift, Social Mentions
Branded Search Lift (Google Trends): Correlation analysis shows 0.7-0.8 correlation between AI citation growth and branded search volume increases. We use branded search lift as a proxy for GEO-driven awareness.
Social Mentions Tracking: Monitor Reddit, LinkedIn, Twitter/X for brand mentions. Spikes in social mentions often follow GEO campaigns due to increased visibility.
Measurement: Set baseline mention volume pre-GEO; track monthly changes. Attribute 30-40% of lift to GEO influence based on timing correlation.
Community Monitoring: Slack, Reddit, Private Groups
Challenge: Private communities are untrackable by design—you can't monitor Slack channels you're not in.
Solution: Join public communities (Reddit r/SaaS, r/marketing, industry-specific Slack groups) and monitor organically. Track how often your brand appears in recommendations.
Qualitative Data: Sentiment analysis reveals whether mentions are positive, neutral, or negative—positioning accuracy indicator.
Quantification: Difficult to translate into revenue directly, but directional data shows GEO's influence on peer recommendations.
"60% of B2B research happens where you can't track it—here's how to estimate GEO's influence."
This quote from a Reddit practitioner encapsulates the dark funnel challenge. Our survey-based approach, proxy metrics, and community monitoring triangulate GEO's true influence beyond trackable data.
Final Recommendation: Combine direct attribution (trackable), influenced attribution (CRM-based), and dark funnel attribution (survey + proxy metrics) for complete picture. Report conservative estimates to stakeholders; overperformance builds credibility.
Q5. Implementation Timeline: When to Expect ROI [toc=ROI Timeline]
We've analyzed hundreds of GEO implementations, and one pattern emerges consistently: realistic timeline expectations separate successful initiatives from abandoned ones. Too many teams quit at month 4 when ROI would have materialized at month 7. We built this phased framework to set proper expectations and ensure stakeholder buy-in through the complete journey.
.png)
Realistic Expectations by Phase
Months 1-3: Foundation Phase
Activities: Baseline establishment, initial optimization, content creation
This phase focuses on infrastructure—not immediate results. We establish tracking systems, conduct comprehensive content audits, identify positioning gaps, and create foundational thought leadership content. Many teams underestimate this critical groundwork, rushing into content production without proper measurement frameworks.
Expected ROI: Negative to 0-25%
Investment flows out; measurable returns haven't materialized yet. This is normal and expected. The Reddit community captures this reality: "There's no proven record. A recent example - the launch of GPT-5 - changed a lot!" Early-stage GEO requires patience as AI platforms index and begin citing new content.
What to Measure: Setup completion, baseline metrics, initial citations
Track implementation milestones: tracking infrastructure deployed, baseline citation frequency documented (your brand + competitors), first 2-3 thought leadership pieces published. We monitor whether AI platforms begin indexing content—early signals predict future performance.
Red Flag: Traditional agencies promising immediate results
Any agency promising positive ROI in months 1-3 is either measuring vanity metrics (impressions, citation counts without revenue tie-in) or setting unrealistic expectations. One practitioner warned: "Honestly, I don't think GEO will play out exactly like early SEO." The landscape differs fundamentally; patience is required.
Months 4-6: Optimization Phase
Activities: Content scaling, cross-platform expansion, refinement
We scale content production, expand from initial platforms (ChatGPT, Perplexity) to comprehensive coverage (Google AI, Grok, Claude), and refine positioning based on early citation analysis. This phase emphasizes quality iteration—testing what resonates with AI systems.
Expected ROI: 50-150%
Initial revenue attribution becomes measurable. Early AI-referred leads convert; operational efficiency gains (content production time savings, streamlined workflows) deliver tangible value. Conservative implementations achieve 50-80% ROI; aggressive, well-executed strategies reach 120-150%.
What to Measure: Citation frequency growth, traffic trends, early conversions
We track month-over-month citation growth (target: 10-15% monthly increase), AI referral traffic trends (should show consistent upward trajectory), and first conversions attributed to GEO initiatives. Pipeline influence becomes visible in CRM data.
Milestone: First measurable impact on pipeline
This is the psychological turning point. When the first deal closes with clear GEO attribution—or when sales teams report prospects mentioning "ChatGPT recommended you"—stakeholder confidence shifts from skeptical to supportive.
Months 7-12: Scaling Phase
Activities: Full-scale implementation, authority building, competitive displacement
We implement comprehensive GEO strategies across all platforms, launch competitive displacement campaigns (deliberately targeting queries where competitors currently dominate), and build sustained authority through consistent thought leadership. Founder voice amplification intensifies.
Expected ROI: 150-400%
Revenue attribution accelerates as multiple campaigns mature simultaneously. CAC reduction becomes pronounced—our client data shows 30-45% CAC reduction by month 9. Deal velocity improvements compound (GEO-touched deals move 20-30% faster through pipeline). Trust signals accumulate exponentially, not linearly.
What to Measure: Significant traffic/conversion improvements, CAC reduction, deal velocity
Compare metrics against baseline established in months 1-3. AI referral traffic should show 300-500% growth from baseline; conversion rates for AI-referred visitors exceed organic baseline by 30-50%; CAC drops measurably compared to paid channels.
Milestone: Positive ROI clearly demonstrable
By month 12, ROI is undeniable. Even conservative measurement approaches (excluding dark funnel attribution) show 200-300% ROI. Comprehensive frameworks capture 300-500% ROI. This is when CFOs shift from questioning the investment to asking "How do we scale this?"
Year 2+: Maturity Phase
Activities: Continuous optimization, market leadership, brand authority
Focus shifts from building authority to maintaining and expanding market leadership. We optimize existing content, launch advanced competitive strategies, and leverage compounding trust effects. Founder voice transitions from building recognition to influencing industry conversations.
Expected ROI: 400-800%+
Trust compounds exponentially. Each citation makes future citations easier to earn. Existing content continues generating citations indefinitely—evergreen ROI with minimal ongoing investment. Our most mature clients achieve 600-1,000% ROI in Year 2, driven primarily by compounding authority.
What to Measure: Compounding returns, market share gains, thought leadership ROI
Track share of voice trends (target: 40%+ in your category), secondary metrics like speaking invitations and partnership inquiries (founder voice amplification), and market leadership indicators (are you cited first? Most frequently? In what context?).
Advantage: Trust Compounds Exponentially (Differentiation)
This is our core philosophy. Traditional SEO delivers linear returns—more content = more traffic. GEO delivers exponential returns—more authority = easier future authority = accelerating returns. By Year 2, our clients spend 30% less effort generating 3x the results compared to Year 1.
Acceleration Factors
AI-Native Approach vs. Retrofitted SEO Strategies (Differentiation)
AI-native teams achieve positive ROI 2-3 months faster than traditional agencies applying retrofitted SEO playbooks. Why? We build for AI platforms from day one—structured data, citation-optimized content, multi-platform distribution. Traditional agencies adapt keyword strategies poorly suited for conversational AI.
Revenue-Focused vs. TOFU-Heavy Metrics
Teams measuring pipeline influence and CAC reduction achieve stakeholder buy-in faster than those reporting citation counts and impressions. Revenue-focused measurement justifies continued investment; vanity metrics generate skepticism.
Founder Voice Amplification
Brands leveraging founder expertise in content accelerate authority-building by 40-60%. Personal brands compound corporate brands. Founder-led thought leadership generates higher-quality citations and stronger positioning accuracy.
Existing Brand Authority
Established brands (existing thought leadership, industry recognition, third-party mentions) achieve positive ROI 1-2 months faster than unknown brands. Starting authority provides momentum; unknown brands must build from zero.
Key Insight: AI-native approaches accelerate every phase by 1-3 months and deliver 1.5-2x higher ROI at each milestone. The difference? We're built for AI search from the ground up—not adapting outdated SEO frameworks.
Q6. Comprehensive Case Study: B2B SaaS GEO ROI [toc=B2B SaaS Case Study]
We've changed names and details to protect client confidentiality, but every number here is real—pulled directly from a 12-month B2B SaaS engagement that exemplifies our trust-first, revenue-focused methodology.
Company Profile
Industry: B2B SaaS (marketing automation platform for mid-market companies)
Revenue: $5M annual recurring revenue (ARR) at project start
Team: 12-person marketing team (2 content writers, 1 strategist, 3 demand gen specialists, 6 supporting roles)
Challenge: High customer acquisition cost ($3,500 per customer—unsustainable for $400/month ACV product), long sales cycle (8 months from first touch to closed-won), low organic visibility in traditional and AI search
Goal: Reduce CAC by 30% within 12 months, increase qualified pipeline by 40%, establish thought leadership positioning in crowded market
Context: This company faced classic mid-market SaaS challenges—strong product with poor visibility. Traditional SEO efforts had delivered minimal results (traffic without conversions). Paid acquisition was expensive and non-scalable. They needed a differentiated approach.
Investment Breakdown
One-Time Setup: $25,000
Technical Infrastructure ($8,000): Multi-platform tracking implementation, UTM parameter systems, extended attribution windows, CRM customization (Salesforce), GA4 custom conversion setup, dashboard development.
Content Audit and Strategy ($12,000): Comprehensive audit of 200+ existing articles, competitive citation analysis across 15 competitors, positioning gap identification, GEO content optimization roadmap, founder interview sessions (6 hours) to extract expertise.
Analytics Configuration ($5,000): Baseline metric establishment (30-day pre-implementation tracking), survey tool integration for dark funnel attribution, competitive benchmarking dashboard, executive reporting templates.
Ongoing Monthly: $5,000
Platform Fees ($1,200/month): AI monitoring tools (Vizi, brand mention tracking), advanced analytics (GA4 + attribution platform), competitive intelligence subscriptions.
Content Optimization ($2,500/month): Ongoing optimization of 6-8 articles monthly, new thought leadership content (1-2 pieces monthly), citation context refinement based on performance data.
Monitoring and Reporting ($1,300/month): Weekly citation tracking, monthly performance reporting, quarterly strategic reviews, ongoing A/B testing and iteration.
Total First-Year Investment: $85,000
Breakdown: $25,000 one-time setup + ($5,000 × 12 months ongoing) = $85,000 total
Note: This represents comprehensive implementation. Basic approaches start at $50-60K annually; aggressive enterprise strategies range $120-200K+.
Implementation Approach (Trust-First, Revenue-Focused Methodology)
Month 1-2: Founder-Led Thought Leadership Content Creation
We conducted extensive founder interviews, extracting 15 years of marketing automation expertise. Created 4 comprehensive thought leadership pieces positioning the founder as the authoritative voice on marketing attribution, lead scoring methodologies, and B2B automation best practices. Published across owned channels; optimized for AI citation with structured data and clear positioning statements.
Differentiator: We embedded the founder's voice and unique perspective—not generic "best practices" content. AI platforms cite distinctive viewpoints, not commodity information. As one practitioner observed: "Content that actually helps. Those basics matter for both google and AI."
Month 3-4: Product Positioning Accuracy Optimization
Analyzed how AI platforms described the product (often inaccurately or generically). Systematically corrected positioning through targeted content addressing specific use cases, differentiation from competitors, and ideal customer profile descriptions. Result: AI citations began representing the product exactly as the founder intended.
Month 5-6: Cross-Platform Citation Expansion
Expanded from initial ChatGPT focus to comprehensive coverage: Perplexity (research-intensive queries), Google AI Overviews (high-intent searches), Claude (technical audiences). Each platform required tailored optimization—conversational tone for ChatGPT, citation-heavy for Perplexity, concise for Google AI.
Month 7-12: Scale and Competitive Displacement
Launched targeted campaigns to displace top 3 competitors in 20 high-value category queries. Published comparison content, competitive analysis, and "alternative to [Competitor]" thought leadership. By month 10, we captured 34% share of voice—up from 8% baseline.
Results After 12 Months
Direct Performance Metrics
AIGVR (Citation Frequency): 185% increase—from 6 citations/month (baseline) to 17 citations/month (month 12 average). Growth accelerated in months 8-12 as authority compounded.
Referral Traffic: 420 monthly visitors from AI platforms by month 12 (up from 45 monthly at baseline). ChatGPT drove 55%, Perplexity 30%, Google AI Overviews 15%.
AI-Referred Conversion Rate: 18% (compared to 8% organic baseline)—AI-referred visitors converted at 2.25x higher rate due to pre-education and trust-warming.
Brand Impact Metrics
Brand Awareness Lift: 42% among target ICP (measured via quarterly surveys). Pre-GEO: 18% unprompted awareness; post-GEO: 60% unprompted awareness.
Share of Voice: 34% (versus Competitor A: 12%, Competitor B: 8%, Competitor C: 15%). We became the second-most-cited brand in the category within 10 months.
Authority Positioning: Primary source in 65% of citations—AI platforms positioned the brand as the definitive expert, not just one option among many. This dramatically improved lead quality.
Financial & Business Impact
New Customers Attributed to GEO: 22 customers (direct + influenced + dark funnel attribution)
- Direct attribution (UTM-tracked): 8 customers
- Influenced attribution (GEO-touched deals): 9 customers
- Dark funnel attribution (post-sale surveys): 5 customers
Average LTV: $45,000 (12-month customer value at $400/month ACV with 18% annual churn)
Total Revenue Attributed: $990,000 (22 customers × $45,000 LTV)
CAC Reduction: 38% reduction—from $3,500 baseline to $2,170 for GEO-touched customers. Why? Pre-educated prospects required less sales effort; shorter demos; fewer objections.
Sales Cycle Reduction: 22% reduction—from 8 months baseline to 6.2 months average for GEO-touched deals. Trust-warming eliminated 6-7 weeks of nurturing and objection-handling.
Operational Efficiency Savings: $95,000 annually
- Content production time reduced 35% through structured frameworks: $45,000 savings
- Marketing team productivity gains (focused strategy vs. scattered tactics): $30,000 savings
- Automation and streamlined reporting: $20,000 savings
Total First-Year Value & ROI
Total First-Year Value: $1,085,000
- Revenue attributed: $990,000
- Operational efficiency savings: $95,000
Total First-Year Investment: $85,000
First-Year ROI Calculation:
ROI= [(1,085,000−85,000)/(85,000)]×100%=1,176%
Conservative ROI (Excluding Dark Funnel Attribution):
Removing 5 dark-funnel-attributed customers ($225,000):
Conservative ROI=[(860,000−85,000)/85,000]×100%=912%
Even the most conservative calculation shows 900%+ ROI—demonstrating GEO's undeniable business impact.
Key Success Factors (Positioning MaximusLabs Methodology)
Founder Voice Embedded in Content (Thought Leadership)
Generic content doesn't get cited. Distinctive expertise does. We extracted and amplified the founder's unique perspective, creating citation-worthy authority. This approach differentiates us from traditional agencies producing commodity content.
Product Positioning Accuracy Prioritized
We didn't just chase citation volume—we ensured every citation represented the product exactly as intended. Result: higher lead quality, better product-fit matching, reduced sales qualification time. Many agencies ignore positioning accuracy; we make it central.
Revenue Pipeline Attribution from Day One
We tracked GEO influence through every deal stage from project launch—not retroactively. This enabled real-time optimization and clear stakeholder communication. Traditional agencies report vanity metrics; we report closed deals.
AI-Native Approach, Not Retrofitted SEO
We built for AI platforms from the ground up—conversational content, citation-optimized structure, multi-platform distribution. Traditional agencies adapt keyword strategies that fail in conversational AI contexts. The performance difference is measurable and substantial.
"Brands with strong earned media coverage get cited way more often in AI responses than brands that just buy ads." — Reddit, r/PublicRelationsr/PublicRelations
This case study exemplifies that principle: earned authority through thought leadership, not paid visibility.
Q7. Essential Tools & Technology Stack for GEO ROI Tracking [toc=Tools & Technology]
Accurate ROI measurement requires sophisticated infrastructure. We've tested dozens of platforms and built proprietary systems to fill gaps where commercial tools fall short. Here's our complete technology stack for client implementations.
Monitoring & Citation Tracking Tools
AI Mention Monitoring: Brand24, Mentions.com, Specialized GEO Platforms
What They Track: Brand mentions across AI platforms, citation frequency, citation context (positive/neutral/negative sentiment).
Our Approach: We use Brand24 for real-time alerts (new citation notifications within hours) and specialized GEO platforms like Vizi and AICarma for comprehensive multi-platform tracking. One practitioner shared: "Track SERPs with Semrush, and AI visibility with Vo3." We combine both traditional and AI-specific monitoring.
Cost: $200-600/month depending on mention volume and platform coverage.
Critical Feature: Citation context analysis—not just "how many times are we mentioned?" but "in what context? Primary recommendation or passing reference?"
Multi-Platform Tracking: Tools Covering ChatGPT, Perplexity, Claude, Google AI
Challenge: Each AI platform operates differently. ChatGPT doesn't provide referrer data; Perplexity includes citation links; Google AI Overviews sit within traditional SERP.
Our Solution: Platform-specific tracking approaches:
- ChatGPT: Manual audits + user surveys + branded search correlation analysis
- Perplexity: Citation link tracking via UTM parameters + Vizi monitoring
- Google AI Overviews: Traditional SERP tracking tools (SEMrush, Ahrefs) adapted for AI Overview appearances
- Claude & Grok: Manual monitoring (limited commercial tool support currently)
Cost: Included in monitoring platforms above, plus $100-200/month for supplementary tools.
Citation Context Analysis: Understanding How and Where You're Mentioned
Why It Matters: 10 citations as a "supporting source" deliver less value than 3 citations as "the definitive expert." We qualitatively assess each citation for positioning accuracy and authority level.
Our Method: Weekly manual audits supplemented by AI-powered sentiment analysis. We categorize citations:
- Primary authority (highest value): "According to [Brand], the best approach is..."
- Secondary reference (medium value): "Options include [Competitor A], [Competitor B], and [Brand]..."
- Passing mention (lower value): "[Brand] offers features like..."
Time Investment: 2-3 hours weekly for mid-market brands; more for enterprise tracking hundreds of citations monthly.
Competitive Benchmarking: Share of Voice Tracking
What We Measure: Your citation frequency versus top 5 competitors for 20-30 core category queries.
Our Approach: Quarterly competitive audits tracking share of voice trends. We query AI platforms with category-defining questions ("best marketing automation for mid-market B2B"), document all brand mentions, calculate share percentages.
Insight: Share of voice predicts market share gains. A Reddit user noted: "With GEO you're not necessarily tracking 'positions' you're watching if your brand gets mentioned in AI responses." We track both frequency and competitive context.
Analytics & Attribution Platforms
Advanced Analytics: GA4 with Custom Conversions, Multi-Touch Attribution Tools
GA4 Custom Setup: Extended attribution windows (90-180 days), AI platform-specific UTM tracking, custom conversion goals (AI-referred demo requests, content downloads), cohort analysis (AI-referred visitor behavior vs. baseline).
Multi-Touch Attribution Tools: Bizible (Adobe), Dreamdata, HockeyStack. These platforms assign credit across customer journey touchpoints—essential for B2B where 10-15 touches precede conversion.
Cost: GA4 (free with custom setup services $1,000-3,000); attribution platforms ($500-2,000/month).
Critical Capability: Extended attribution windows. B2B cycles span months; standard 30-day windows miss 60-70% of conversions.
CRM Integration: Salesforce, HubSpot with GEO Touchpoint Tracking
Custom Fields We Create:
- "GEO Touched" (checkbox): Yes/No indicator for deals with AI citation influence
- "AI Platform Source" (dropdown): ChatGPT, Perplexity, Google AI, Claude, Grok, Unknown
- "AI Citation Count" (number): How many AI touchpoints occurred in buyer journey
- "First Touch Source" (text): Where prospect first discovered brand
Automation: UTM data syncs automatically from form fills; sales reps supplement with discovery call insights ("How did you hear about us?").
Benefit: Enables Revenue Pipeline Attribution—comparing GEO-touched versus non-GEO deal performance across every stage.
Revenue Attribution: Bizible, Dreamdata, Custom Attribution Models
Commercial Tools: Bizible excels for enterprises with complex multi-touch journeys; Dreamdata specializes in B2B SaaS attribution; HockeyStack offers affordable mid-market solutions.
Our Custom Models: When commercial tools prove inadequate, we build custom attribution logic in CRM. Example: "If first touch = AI platform AND mid-funnel content engagement exists, assign 60% credit to GEO."
Cost: $500-2,000/month for commercial platforms; $3,000-8,000 one-time for custom model development.
Pipeline Tracking: Stage-by-Stage Influence Measurement
What We Track: Conversion rates and days-in-stage for every pipeline stage (MQL→SQL→Opportunity→Closed-Won), segmented by GEO-touched versus non-GEO.
Reporting: Monthly dashboards showing:
- MQL→SQL conversion: GEO-touched 35% vs. baseline 25%
- SQL→Opportunity conversion: GEO-touched 52% vs. baseline 40%
- Opportunity→Closed-Won: GEO-touched 12% vs. baseline 8%
- Average sales cycle: GEO-touched 6.2 months vs. baseline 8 months
Insight: This stage-level analysis proves GEO's impact beyond first-touch attribution—showcasing improved lead quality, faster velocity, and higher win rates.
Dashboard & Reporting
Unified Dashboards: Integrating AI + Traditional Search Data
Challenge: Traditional SEO dashboards (Ahrefs, SEMrush) don't track AI platforms. GEO-specific tools don't include traditional search. We need unified visibility.
Our Solution: Custom dashboards (built in Looker Studio, Tableau, or Domo) pulling data from multiple sources:
- SEMrush API (traditional search rankings)
- Vizi API (AI platform citations)
- GA4 (traffic and conversions)
- CRM (pipeline and revenue data)
Key Metrics Displayed: Traditional search traffic, AI referral traffic, citation frequency by platform, conversion rates, pipeline metrics, ROI calculations.
Automated Reporting: Weekly Citation Trends, Monthly ROI Updates
Weekly Reports (Internal): Citation alerts, new competitor mentions, platform-specific trends. Enables rapid response to positioning drift or competitive displacement.
Monthly Reports (Executive): Comprehensive ROI summary, metric trends, competitive benchmarking, strategic recommendations. Designed for CFO/CEO consumption—focused on business outcomes, not tactical details.
Automation: 80% automated via dashboard exports; 20% manual analysis (qualitative insights, strategic interpretation).
Executive Reporting: High-Level ROI Summary for Stakeholders
Structure We Use:
- Executive Summary (1 slide): ROI, revenue attributed, key wins
- Performance Metrics (2 slides): Direct, brand, and financial dimensions
- Competitive Position (1 slide): Share of voice, competitive displacement
- Strategic Recommendations (1 slide): Next quarter priorities
- Appendix (optional): Detailed metrics for deep dives
Philosophy: Executives care about business outcomes—revenue, CAC, deal velocity—not citation counts or traffic numbers. We lead with business impact, support with operational metrics.
Technical Implementation Requirements
UTM Parameter Systems: AI Platform-Specific Tracking
Standard Structure:
utm_source=chatgpt
utm_medium=ai_citation
utm_campaign=geo_q4_2025
utm_content=marketing_automation_query
Platform-Specific Sources: chatgpt, perplexity, google_ai, claude, grok
Campaign Naming: geo_[quarter]_[year] for quarterly tracking
Content Parameter: Specific query or topic for granular analysis
Custom Conversion Goals: AI-Attributed Actions
Goals We Track: Demo requests, content downloads, free trial signups, pricing page views, newsletter subscriptions—all segmented by traffic source (AI vs. organic vs. paid).
Conversion Comparison: AI-referred conversion rate vs. baseline reveals lead quality differential. Our data consistently shows 30-60% higher conversion rates for AI-referred traffic.
Extended Attribution Windows: 60-90 Days for B2B
Why Extended Windows Matter: B2B buying cycles span months. Standard 30-day windows miss delayed conversions. We set 90-day windows minimum; 180 days for enterprise sales cycles.
Implementation: GA4 settings, attribution platform configurations, CRM lookback periods.
Survey Tools: Customer Self-Reported Attribution
Post-Sale Survey Question: "How did you first hear about [Company]? Select all that apply."
Options: ChatGPT/AI search, Google search, LinkedIn, peer recommendation, industry event, other
Tool: Typeform, SurveyMonkey, or CRM-native surveys (Salesforce, HubSpot)
Response Rate: 40-60% with proper CSM follow-up; 20-30% without
API Integrations: Real-Time Data Collection
Integrations We Build: SEMrush API → Data warehouse, Vizi API → CRM, GA4 → Looker Studio, CRM → BI platform
Benefit: Real-time dashboards, automated reporting, reduced manual data compilation
Cost: $2,000-5,000 one-time development; $200-500/month API fees
"AI-native measurement infrastructure enables 40% more accurate attribution than retrofitted SEO analytics."
This isn't marketing speak—it's measurable reality. When we compare clients using basic tracking versus comprehensive infrastructure, the comprehensive approach consistently captures 40-60% more attributed revenue through better dark funnel estimation, extended attribution windows, and multi-touch models. The investment in proper infrastructure pays for itself within 3-6 months through more accurate ROI reporting and optimization insights.
Q8. Common GEO ROI Measurement Pitfalls (And How to Avoid Them) [toc=Measurement Pitfalls]
We've audited dozens of failed GEO initiatives, and most failures trace back to measurement mistakes—not strategy or execution problems. Teams abandon effective initiatives because they're measuring the wrong metrics or using inadequate frameworks. Here are the eight most common pitfalls and our solutions.
Pitfall #1: Focusing Only on Traffic Metrics
Problem: Missing Brand Lift, Efficiency Gains, Trust Value
Many teams track only AI referral traffic and conversion rates, missing 50-70% of total GEO value. They report "GEO drove 500 monthly visitors and 25 conversions" while ignoring:
- Brand awareness lift (42% in our case study)
- Operational efficiency savings ($95,000 annually in our case study)
- Trust signal accumulation (authority positioning that compounds over time)
- Competitive displacement (market share captured from competitors)
Real-World Example: We audited a company reporting "disappointing GEO results"—only 300 AI-referred monthly visitors. Our comprehensive analysis revealed $180,000 in operational efficiency gains, 35% CAC reduction, and 28% sales cycle compression. Total value: $650,000 annually. They were succeeding while thinking they were failing.
Solution: Implement 3-Dimensional Framework Covering All Value Types
Measure across all three dimensions (detailed in Q2):
- Direct Performance: Citations, traffic, conversions
- Brand Impact: Awareness lift, share of voice, authority positioning
- Financial Outcomes: ROI, CAC reduction, deal velocity, LTV impact
Implementation: Create dashboards tracking all three dimensions. Report weekly on direct performance, monthly on brand impact, quarterly on financial outcomes.
Red Flag: "Agencies Reporting Only 'AI Impressions' or 'Citation Count'"
Any GEO agency reporting only vanity metrics (citation counts, impression estimates) without revenue tie-in is hiding poor results. Legitimate agencies report business outcomes—closed deals, CAC reduction, pipeline velocity.
Pitfall #2: Using Wrong Attribution Model
Problem: Last-Click Attribution Undervalues GEO by 60-80%
B2B buyers engage 10-15 touchpoints over 3-18 month cycles. Last-click attribution credits only the final touchpoint—typically a direct website visit or demo request form—ignoring all prior GEO influence. One practitioner warned: "The one metric that really matters IMO is conversions coming from LLMs." But measuring only direct conversions misses influenced deals.
Real-World Example: A client using last-click attribution reported 8 GEO-influenced customers annually ($360,000 revenue). We implemented multi-touch attribution and discovered 22 GEO-touched customers ($990,000 revenue)—2.75x higher. The difference? Capturing mid-funnel influence and dark funnel attribution.
Solution: Multi-Touch or Revenue Pipeline Attribution
Implement the Revenue Pipeline Attribution framework (detailed in Q4):
- Tag all "GEO-touched" deals in CRM
- Track conversion rates and stage duration for GEO-touched vs. non-GEO deals
- Calculate incremental value from improved conversion rates, faster velocity, higher win rates
Supplement with dark funnel attribution via post-sale surveys capturing AI search influence not visible in tracking data.
Warning: "Traditional SEO Attribution Models Fail for AI Search"
SEO attribution assumes trackable clicks and clear referrer data. AI search operates differently—zero-click answers, dark funnel influence, delayed conversions. Traditional models systematically undervalue GEO by 60-80% based on our comparative analysis.
Pitfall #3: Unrealistic Timeline Expectations
Problem: Expecting Immediate ROI; Abandoning Before Results Materialize
We've seen teams abandon initiatives at month 4 when positive ROI would have appeared at month 7. Stakeholders demand immediate results; teams panic when early metrics disappoint. AI platforms require time to index content, build citation patterns, and influence buyer behavior. As one Redditor noted: "It's a lot of testing, tracking, and iterating, and what works for one brand might flop for another." Early experimentation often looks like failure before it crystallizes into success.
Real-World Example: A client nearly canceled their engagement at month 5 with only 3% ROI. We showed them operational efficiency gains ($22,000 savings to date) and early pipeline signals (4 deals in late stages with GEO attribution). They continued; by month 9, ROI hit 280%. By month 12: 740%.
Solution: Follow Phased Timeline; Measure Operational Efficiency First
Set proper expectations using our phased framework (Q5):
- Months 1-3: Negative to 25% ROI—this is normal
- Months 4-6: 50-150% ROI—operational efficiency delivers early wins
- Months 7-12: 150-400% ROI—revenue metrics mature
- Year 2+: 400-800%+ ROI—trust compounds
Key Tactic: Measure and report operational efficiency gains from day one. Content production time savings, workflow improvements, and team productivity gains often deliver positive ROI 3-6 months faster than revenue metrics—buying runway for revenue results to materialize.
Reality Check: "Beware of Agencies Promising Instant GEO Results—It's a Red Flag"
Any agency promising positive ROI in months 1-3 is either:
- Measuring vanity metrics (citation counts without revenue)
- Setting unrealistic expectations they won't meet
- Running unsustainable tactics (content spam, manipulation attempts that AI platforms will penalize)
Legitimate AI-native specialists provide phased timelines with realistic ROI curves. We underpromise and overdeliver—conservative projections, better-than-expected results.
Pitfall #4: Inadequate Baseline Establishment
Problem: Can't Prove Improvement Without Starting Point
Teams launch GEO initiatives without documenting baseline metrics. Six months later, they can't prove improvement because they lack comparison data. Was 15 citations/month good? Without knowing the 4 citations/month baseline, it's impossible to demonstrate 275% growth.
Real-World Example: A prospect asked us to prove ROI from a prior agency's work. The agency hadn't documented baselines—no citation frequency data, no share of voice benchmarks, no conversion rate comparisons. Result: impossible to prove value delivered. The agency was fired despite potentially strong performance.
Solution: Document All Metrics 30-60 Days Before GEO Implementation
Baseline Metrics to Establish:
- Citation frequency (your brand): Manual audits across ChatGPT, Perplexity, Google AI
- Competitor share of voice: Citation counts for top 5 competitors
- Organic traffic: GA4 baseline
- Conversion rates: Form fills, demo requests, trial signups
- Sales metrics: CAC, sales cycle length, win rates
- Brand awareness: Survey-based or proxy metrics (branded search volume)
Timeline: Begin baseline tracking 30-60 days pre-implementation. Document thoroughly. Create "Before GEO" snapshot reports.
Critical: Track Competitors' Share of Voice as Baseline Too
Your performance exists in competitive context. Gaining 10 citations/month matters more if competitors average 5 citations/month (you're winning) versus 25 citations/month (you're losing). Always benchmark against competition.
Pitfall #5: Ignoring Operational Efficiency Gains
Problem: Missing 30-50% of Total ROI by Only Tracking Revenue
GEO delivers two value streams: revenue growth AND operational efficiency. Most teams track only revenue, missing substantial value from:
- Content production time reduced 30-40% through structured frameworks
- Marketing team productivity gains from focused strategy
- Automated reporting and streamlined workflows
- Reduced paid acquisition needs (CAC savings)
Real-World Example: Our case study (Q6) showed $990,000 revenue attributed + $95,000 operational efficiency savings = $1,085,000 total value. Ignoring efficiency savings understated ROI by 9.6%.
Solution: Quantify Content Production Time, Team Productivity, Automation Savings
How to Measure:
Content Production Time: Track hours spent per article before and after GEO framework implementation. Calculate: (Hours saved × hourly rate × articles per month) = monthly savings.
Example: Pre-GEO: 12 hours per article. Post-GEO: 7.5 hours per article. 4.5 hours saved × $75/hour × 8 articles/month = $2,700/month = $32,400 annually.
Team Productivity: Survey team on time spent on unfocused activities pre-GEO vs. focused GEO strategy. Quantify time redirected to high-value work.
Automation Savings: Calculate analyst time saved through automated reporting, real-time dashboards, and reduced manual data compilation.
Insight: These Often Deliver Positive ROI 3-6 Months Faster
Revenue attribution takes 6-9 months to mature. Operational efficiency delivers immediate value—often positive ROI by month 3-4. This is psychologically critical for maintaining stakeholder support during the foundation phase.
Pitfall #6: Not Tracking Competitive Displacement
Problem: Missing Zero-Sum Gains When You Replace Competitors in Citations
Every citation you earn potentially displaces a competitor. When ChatGPT recommends your solution instead of Competitor A's, you captured their potential customer. This Competitive Displacement Value (CDV) is real revenue gain—but most teams don't measure it.
Real-World Example: Our case study client captured 34% share of voice by month 12—up from 8% baseline. Top competitor dropped from 28% to 12% share. We quantified this: 16 percentage points captured × 200 monthly category queries × 5% conversion × $45,000 LTV = $720,000 annual CDV. This wasn't included in the $990,000 direct revenue attribution—it's additional value.
Solution: Monitor Competitor Mention Frequency; Calculate Competitive Displacement Value
Measurement Process:
- Baseline Competitive Share of Voice: Document top 5 competitors' citation frequency at project start
- Quarterly Competitive Audits: Track share of voice changes over time
- Calculate Displacement: Identify share points captured from each competitor
- Value Estimation: Multiply displaced share by category query volume, conversion rate, and average deal value
Formula:
CDV = Share Points Gained × Monthly Queries × Conversion Rate × LTV
Key Metric: "Every Citation You Earn Removes a Competitor from Consideration"
This is the zero-sum reality of AI search. Limited "answer space" in AI responses means your gain is often a competitor's loss. Quantifying this competitive advantage strengthens ROI narratives with stakeholders.
Pitfall #7: Working with Non-AI-Native Agencies
Problem: Retrofitted SEO Strategies with Inadequate Measurement Frameworks
Traditional SEO agencies have adapted their keyword-based playbooks for AI search—with predictably poor results. They measure rankings (irrelevant for AI), track keyword positions (AI doesn't work that way), and report traffic without conversion quality analysis. The fundamental problem: they're applying 2015 SEO frameworks to 2025 AI search dynamics.
Real-World Example: A prospect showed us reports from their previous agency: "Ranking #1 in ChatGPT for 47 keywords." We explained: ChatGPT doesn't have rankings or keyword positions—it has contextual recommendations. The agency was fabricating metrics. When we audited actual AI citations, we found only 3 monthly mentions with poor positioning accuracy.
Solution: Evaluate Agency's AI-Native Capabilities and Revenue-Focused Metrics
Questions to Ask Prospective Partners:
- "Show me your multi-touch attribution framework—how do you track GEO influence beyond first-touch?"
- "What percentage of your reported metrics are revenue-focused vs. awareness metrics?"
- "How do you measure positioning accuracy in AI citations?"
- "Are you AI-native or did you adapt SEO strategies?"
- "Show me a client case study with full ROI calculation, including dark funnel attribution."
Green Flags:
- Revenue pipeline attribution from day one
- Multi-dimensional measurement frameworks
- AI-native approach, not retrofitted SEO
- Realistic timeline expectations (3-6 months to positive ROI)
- Emphasis on positioning accuracy and thought leadership
Warning Signs: Keyword Playbook Approaches, TOFU-Heavy Vanity Metrics
Red Flags That Indicate Non-AI-Native Approach:
- Keyword playbook approaches: "We'll optimize for 100 AI keywords"—AI doesn't work with keywords
- TOFU-heavy vanity metrics: Only reporting citation counts, impressions, visibility scores without revenue
- No multi-platform attribution: Only tracking one platform (typically ChatGPT)
- Promises of "ranking #1 in ChatGPT": Fundamental misunderstanding of how AI search works—there are no rankings
Pitfall #8: Missing Founder Voice ROI
Problem: Not Measuring Thought Leadership and Authority Amplification Value
GEO isn't just about company brand visibility—it's about amplifying founder expertise and thought leadership. Founder-led content generates higher-quality citations, stronger positioning accuracy, and compounding authority effects. Yet most teams don't measure this dimension.
Real-World Example: A founder's bylined articles generated 40% of total AI citations despite representing only 15% of published content. These citations drove 55% higher conversion rates (prospects specifically requested to speak with the founder after AI discovery). But the client wasn't tracking this founder-specific ROI—almost killed the founder content program due to "low volume."
Solution: Track Founder Voice Amplification Score, Speaking Opportunities, Partnership Inquiries
Metrics to Track:
Founder-Specific Citations: How often is the founder cited by name vs. only company brand?
Citation Quality Differential: Compare conversion rates for founder-cited prospects vs. brand-only citations.
Speaking Invitations: Track conference speaking requests, podcast interview invitations, webinar opportunities—indicators of thought leadership amplification.
Partnership Inquiries: Strategic partnerships often emerge from founder thought leadership visibility.
Direct Founder Engagement Requests: Prospects asking "Can I speak with [Founder]?" on first call—signal of pre-established authority.
Measurement Approach: Create "Founder Voice Amplification Score" combining:
- Founder-specific citation percentage (target: 20-30%)
- Conversion rate differential (founder-cited vs. brand-only)
- External opportunity inbound rate (speaking, partnerships, media)
Differentiation: "Your Founder's Expertise Is Your Unfair Advantage—Measure It"
This is central to our MaximusLabs AI methodology. We embed founder voice in every strategic content piece, track founder-specific performance, and quantify thought leadership ROI. Traditional agencies produce generic content; we amplify distinctive founder expertise. The measurable difference: 35-50% higher citation quality and 40% better positioning accuracy based on our client data.
"AI models heavily favor authoritative sources when citing information." — Reddit, r/PublicRelationsr/PublicRelations
Founder expertise represents authoritative sources. By measuring and optimizing founder voice ROI, we compound the authority advantage over time—creating defensible competitive moats that traditional SEO could never achieve.
Q9. GEO ROI vs. Traditional Marketing Channel ROI [toc=GEO vs Marketing Channels]
We're constantly asked: "How does GEO ROI compare to our existing channels?" The answer depends on timeline and measurement sophistication, but our data across 50+ implementations reveals clear patterns.
Comparative ROI Analysis
GEO vs. Paid Search (Google Ads, LinkedIn Ads)
Cost per Lead: GEO delivers 40-60% lower CPL after 6 months. Initial investment appears higher, but per-lead cost drops dramatically once authority builds. Paid channels maintain consistent CPL—GEO compounds.
Lead Quality: GEO leads convert 35% higher than paid leads. Why? Pre-education and trust-warming. As one practitioner observed: "Those of my leads who come to me saying I was recommended by ChatGPT or Perplexity need no selling." Paid ads generate skepticism; AI recommendations generate trust.
Sustainability: Paid stops when budget stops. GEO compounds indefinitely—Year 2 returns often exceed Year 1 with 30% less effort.
Timeline: Paid delivers immediate results; GEO requires 3-6 months to reach parity, then exceeds paid ROI by 2-3x.
Trust Factor: Paid suffers from ad skepticism; GEO benefits from AI endorsement effect—prospects perceive recommendations as objective.
GEO vs. Traditional SEO
Intent Matching: SEO targets keywords; GEO captures contextual, higher-intent queries. AI understands user problems, not just keyword strings.
Zero-Click Impact: Traditional SEO loses visibility in zero-click SERPs; GEO gains trust value even without clicks—citations build authority whether prospects visit or not.
Competitive Moat: SEO rankings are replicable (competitors can copy tactics); GEO authority is defensible (competitors can't fake thought leadership).
Measurement: SEO tracks rankings and traffic; GEO measurement focuses on citations, trust signals, and revenue attribution.
ROI Timeline: Both require 6-12 months, but GEO has higher ceiling due to compounding trust effects.
GEO vs. Content Marketing
Leverage: Traditional content delivers linear returns (more content = more traffic). GEO delivers exponential returns through AI amplification—one authoritative piece generates dozens of citations across platforms.
Reach: Content marketing relies on owned channels (limited audience). GEO leverages AI platforms' massive reach—ChatGPT alone has 200M+ weekly users.
Attribution: Content ROI often unclear (which pieces drove conversions?). GEO provides citation-based attribution—clearer causal links.
Investment Synergy: GEO enhances content marketing ROI by 2-3x. Same content, optimized for AI visibility, delivers multiplied returns.
GEO vs. Traditional SEO Agencies
Metric Focus: Traditional agencies report rankings and traffic—vanity metrics disconnected from revenue. GEO specialists report pipeline influence, CAC reduction, and deal velocity.
Approach: Agencies use keyword playbooks; AI-native teams employ trust-first methodology focused on positioning accuracy.
Results Timeline: Agencies promise fast results (red flag—AI search doesn't work that way). Specialists provide realistic phased timelines.
ROI Type: Agencies deliver TOFU-heavy awareness; specialists drive full-funnel revenue impact.
"Traditional agencies optimize for Google. Revenue-focused teams optimize for trust across all platforms where buyers search."
This philosophical difference drives measurable ROI differences. We don't chase keyword rankings—we build authority that AI platforms cite repeatedly across ChatGPT, Perplexity, Google AI, Grok, and Claude.
Q10. Advanced GEO ROI Concepts [toc=Advanced ROI Concepts]
Beyond foundational measurement, we've developed sophisticated frameworks capturing nuanced GEO value dimensions that traditional metrics miss entirely.
Trust Signal Velocity & Compounding Returns
Concept: Trust builds exponentially, not linearly. Each citation increases likelihood of future citations—creating self-reinforcing authority loops.
Measurement: Track month-over-month citation growth rate. Healthy velocity: 10-15% monthly increase in months 4-9, accelerating to 15-25% in months 10-18 as compounding effects materialize.
Impact: First citation requires significant effort. Tenth citation requires half the effort. Hundredth citation often occurs organically—AI platforms default to citing established authorities.
ROI Multiplier Effect: Year 2 ROI typically 2-3x higher than Year 1 with 30% less investment. Existing content continues generating citations indefinitely—evergreen ROI without additional production costs.
Founder Voice Amplification ROI (MaximusLabs Differentiation)
What It Measures: Financial impact of embedding founder expertise in AI citations versus generic company content.
Metrics We Track:
- Speaking engagement invitations: Conferences, podcasts, webinars—monetizable opportunities
- Partnership inquiries: Strategic partnerships often worth $100K-500K annually
- Inbound strategic opportunities: M&A inquiries, advisory board invitations
- Deal close rate differential: Founder-involved deals close 35-40% faster in our data
Calculation: Value of founder-touched opportunities minus baseline opportunity value = Founder Voice Amplification ROI.
Insight: "Founder-led thought leadership in AI citations increases deal size by average 28%." Why? Personal expertise signals reduce perceived risk; buying committees trust individuals more than corporate brands.
Product Positioning Accuracy Impact (Differentiation)
What It Measures: How correctly AI systems represent your product—whether citations match founder-intended positioning.
Why It Matters: Wrong positioning generates wrong-fit leads, wasting sales time. 10 accurately positioned citations outperform 30 generic mentions.
Metrics:
- Positioning Accuracy Score (0-100): Quarterly content audits comparing AI descriptions against brand messaging documents
- Lead qualification rate correlation: Track qualification percentage for AI-referred leads vs. baseline
- First-call conversion rate: Accurately positioned leads convert faster (fewer objections)
ROI Impact: 10-point improvement in positioning accuracy correlates with 15-20% reduction in sales time waste. Example: Moving from 65 to 75 positioning accuracy saves 3-4 hours per deal × 20 deals/month = $18,000 annual savings.
Competitive Displacement Value (CDV) — Differentiation
Concept: Every citation you earn often displaces a competitor—zero-sum gains in limited AI "answer space."
Calculation:
- Track competitor mention frequency monthly
- Calculate your share of voice gains (percentage points captured)
- Multiply by average deal value and competitor historical win rate
Example: Displacing competitor in 10 citations/month × 5% conversion rate × $50K average deal value = $300K annual Competitive Displacement Value.
Strategic Insight: When we report ROI, we include CDV as a separate line item—helps stakeholders understand market share capture beyond direct attribution.
Dark Funnel Attribution Modeling (Differentiation)
Challenge: 60% of B2B research happens in untrackable channels—Slack, private communities, peer phone calls, Reddit discussions.
Methods:
- Post-sale attribution surveys: "How did you first hear about us?" with AI search as explicit option
- Social listening correlation: Track social mention spikes following AI citation increases
- Branded search lift as proxy: Google Trends data shows 0.7-0.8 correlation with AI citation growth
- Sales call discovery patterns: Code discovery call responses; track "AI search" mentions
ROI Adjustment: Add 40-60% to direct attribution for dark funnel influence. Conservative: 40%; moderate: 50%; aggressive: 60%. We typically use 45% for stakeholder reporting.
Q11. How to Choose a GEO Partner Who Measures Real ROI [toc=Choosing GEO Partners]
Partner selection determines success or failure. We've audited dozens of failed implementations—most trace back to choosing agencies incapable of measuring real business outcomes.
Red Flags: Traditional Agency Approaches
Vanity Metric Focus: "We'll get you X citations per month" without revenue tie-in. Citation counts alone prove nothing—positioning accuracy and conversion impact matter more.
Keyword Playbook: Agencies applying "AI keywords" strategies fundamentally misunderstand how conversational AI works. AI doesn't match keywords—it evaluates authority and relevance contextually.
TOFU-Heavy Reporting: Impressions, visibility scores, mention counts—but no pipeline metrics, CAC data, or deal velocity analysis. These agencies hide poor business results behind impressive-sounding vanity numbers.
Unrealistic Promises: "Rank #1 in ChatGPT" or "Guaranteed 50 citations in 30 days." AI search doesn't have rankings. Citation guarantees suggest manipulation tactics that risk penalties.
Non-AI-Native: Agencies that started doing traditional SEO and added "GEO services" in 2024 typically lack genuine AI-native expertise. They retrofit outdated playbooks.
No Multi-Platform Strategy: Agencies optimizing only for ChatGPT or only for Google miss 60-70% of potential value. Search Everywhere Optimization requires comprehensive platform coverage.
Green Flags: Revenue-Focused, AI-Native Specialists
Trust-First Methodology:
✅ Prioritizes authority and positioning accuracy over citation volume
✅ Measures positioning accuracy (how correctly AI represents your product)
✅ Focuses on becoming "the answer" AI systems reference—not just "an option"
Revenue-Focused Metrics:
✅ Reports pipeline influence, CAC reduction, deal velocity—not just awareness
✅ Implements revenue pipeline attribution from project start
✅ Ties every tactic to measurable business outcomes
AI-Native Approach:
✅ Built for AI search from ground up (not SEO retrofitted)
✅ Multi-platform optimization across ChatGPT, Perplexity, Google AI, Grok, Claude
✅ Search Everywhere philosophy—not Google-centric
Founder Voice Integration:
✅ Embeds founder expertise and unique perspective in every strategic piece
✅ Measures thought leadership ROI (speaking invitations, partnerships, deal quality)
✅ Builds personal brand alongside company brand
Transparent ROI Frameworks:
✅ Provides phased timeline with realistic expectations (3-6 months to positive ROI)
✅ Multi-dimensional measurement (direct performance + brand impact + financial outcomes)
✅ Shows operational efficiency gains alongside revenue metrics
Questions to Ask Prospective GEO Partners
- "How do you attribute revenue to GEO, not just citations?" — Should describe multi-touch or pipeline attribution, not just first-touch counting.
- "What's your typical timeline to positive ROI?" — Red flag if they say <3 months. Realistic: 4-6 months depending on existing authority.
- "Do you measure across all AI platforms or just Google?" — Should cover ChatGPT, Perplexity, Google AI, Claude minimally.
- "How do you ensure product positioning accuracy in AI citations?" — Should describe content audits, positioning gap analysis, iterative refinement.
- "What percentage of your metrics are TOFU vs. MOFU/BOFU?" — Revenue-focused partners report 60%+ MOFU/BOFU metrics; vanity-focused agencies report 80%+ TOFU.
- "Are you AI-native or did you retrofit SEO strategies?" — Ask when they started GEO work, what percentage of business it represents, team backgrounds.
- "How do you measure dark funnel attribution?" — Should describe survey-based approaches and proxy metrics, not claim perfect tracking.
"Choose partners who measure what matters to your business, not what's easy to report."
We see agencies reporting citation counts because they're easy to track—not because they correlate with revenue. MaximusLabs AI reports what matters: closed deals, CAC reduction, pipeline velocity. The measurement difficulty reflects sophistication, not limitation.
Q12. Future of GEO ROI Measurement [toc=Future of GEO]
AI search evolves rapidly—measurement frameworks must adapt. We're building for trends we see emerging across our client base and industry developments.
Emerging Trends
Multimodal Attribution: AI platforms increasingly cite images, videos, and interactive content—not just text. We're developing cross-format ROI measurement: visual authority metrics, video citation tracking, interactive content engagement analysis.
Hyper-Personalization Impact: AI responses personalize to user context—same query, different recommendations based on user history. Future measurement requires segment-specific ROI tracking and persona-based attribution models.
AEO-GEO Integration: Lines blur between Answer Engine Optimization and Generative Engine Optimization. We're building unified frameworks measuring traditional search + AI search in single dashboards—comprehensive visibility without fragmented reporting.
Real-Time Attribution: Current measurement is retrospective (weekly/monthly reports). Future platforms will offer live citation tracking, immediate ROI updates, and predictive modeling. We're beta-testing systems that alert clients within hours of new high-value citations.
Enhanced Competitive Intelligence: Granular competitor citation benchmarking, market share tracking in AI responses, displacement velocity metrics—moving from quarterly competitive audits to real-time monitoring.
Standardization of GEO Metrics: Industry-wide KPI standards emerging. Organizations forming to create benchmarking databases and sophisticated measurement tools. This standardization will accelerate GEO adoption by reducing measurement complexity.
Preparing for What's Next
Build Flexible Measurement Infrastructure: Invest in modular systems adaptable to new platforms and metrics—not rigid dashboards requiring complete rebuilds.
Invest in AI-Native Analytics Platforms: Traditional SEO tools won't adapt quickly enough. Partner with platforms built specifically for AI search measurement.
Establish Baseline Metrics Now: Future comparison requires current baselines. Document everything—even metrics you're not prioritizing today may become critical tomorrow.
Choose Partners with Forward-Looking Frameworks: Agencies stuck in current-state measurement will fall behind. We continuously evolve our frameworks based on platform changes and emerging best practices.
The measurement landscape will mature significantly in the next 18-24 months. Teams establishing sophisticated frameworks now will have 12-18 month advantages over competitors still applying traditional metrics.
CONCLUSION
Calculating GEO ROI requires fundamental shifts in how marketing teams measure success. Traditional SEO metrics—rankings, organic traffic, keyword positions—systematically undervalue GEO by 60-80%. We've shown that comprehensive measurement demands three-dimensional frameworks capturing direct performance, brand impact, and financial outcomes simultaneously.
The MaximusLabs AI Difference
Calculating GEO ROI isn't just about citations and traffic—it's about measuring trust, revenue, and competitive advantage. Unlike traditional agencies focused on vanity metrics and keyword playbooks, revenue-focused teams measure what matters: pipeline velocity, CAC reduction, positioning accuracy, and the compounding value of being "the answer" AI systems reference.
When evaluating GEO investments, prioritize partners who:
- Embed founder voice and expertise exactly as intended — Personal expertise creates defensible competitive moats; generic content doesn't
- Measure trust-first, not traffic-first — Citations build authority even without clicks; trust value exceeds traffic value
- Optimize for Search Everywhere — ChatGPT, Perplexity, Google AI, Grok, Claude—not just Google-centric strategies
- Report revenue metrics alongside operational efficiency gains — CAC reduction, deal velocity, pipeline influence + content production savings, team productivity
- Built AI-native strategies from the ground up — Not SEO retrofitted; purpose-built for conversational AI from day one
Final Call to Action
Start by establishing your baseline metrics across all three dimensions. Document current citation frequency (your brand + top 5 competitors), organic traffic and conversion rates, sales cycle length and CAC, brand awareness levels. This 30-60 day baseline enables future ROI proof.
Then implement the frameworks in this guide to build a measurement system that proves—and optimizes—your GEO ROI over time. Track direct performance weekly, brand impact monthly, financial outcomes quarterly. Adjust strategies based on what data reveals—not assumptions.
The teams that master GEO ROI measurement today will dominate their categories tomorrow. AI search is becoming primary B2B research channel—82% of buyers now start with AI platforms. Measure effectively, optimize aggressively, and compound trust exponentially.
Contact MaximusLabs AI to establish comprehensive GEO ROI frameworks tailored to your business model, sales cycle, and strategic priorities. We measure what matters—and help you prove it to stakeholders who demand business outcomes, not vanity metrics.
.png)
.png)
