

Q1: Why Traditional SEO Metrics Fail in the Zero-Click Era [toc=Traditional Metrics Fail]
The modern buyer journey no longer begins with Google search results - it starts with AI consultation. When a B2B SaaS founder needs to evaluate AI-powered sales tools, they're likely opening ChatGPT or Perplexity first, asking in natural language: "What are the best AI sales tools for early-stage SaaS teams?" Within seconds, they have an authoritative answer - complete with recommendations, comparisons, and specific use cases - without ever visiting a website.
⚠️ The core problem is stark: traditional SEO metrics (rankings, organic traffic volume, click-through rates) are now meaningless. When 60%+ of AI-generated answers don't drive any clicks because users get their answer directly from the LLM, the entire framework for measuring success collapses.
How Traditional Agencies Miss the Mark
Most legacy SEO agencies still measure success through TOFU (top-of-funnel) vanity metrics. Their dashboards celebrate "impressions up 40%" and "keyword rankings improved 15 positions," but these signals have virtually no correlation with revenue generation or buyer influence. As one marketer put it:
"Everyone should be focused on KPIs. We just need to focus on the right KPIs which will differ by campaign, product, etc." - u/marketing_strategist, r/marketing Reddit Thread
The traditional playbook assumes a deterministic system - put in keyword optimization, get out Google rankings. But AI-powered answer engines operate on a probabilistic model. The same query asked to ChatGPT three times can yield three different answers, with different sources cited. Responses vary. Results aren't guaranteed.
Traditional agencies optimize for the wrong variable: they chase clicks on a platform (Google) that AI is now disintermediating. They ignore the fundamental shift where being cited in an AI response - even with zero clicks - builds brand authority, influences buyer perception, and drives downstream pipeline impact.
The Three-Pillar Measurement Shift
The zero-click era requires a completely different measurement framework. Success now hinges on three interdependent pillars:
✅ Visibility - How often is your brand cited or mentioned in AI responses?
✅ Engagement - When users do find your content via AI, is it high-quality enough to keep them engaged?
✅ Conversion - Are those users moving down the funnel toward qualified leads or revenue?
Traditional metrics address only one: traffic volume. But that's no longer the game. A brand could appear in 50+ AI answers weekly, drive zero clicks, yet generate $2M in attributed revenue through indirect channels (brand searches, word-of-mouth, influenced buying decisions). Standard tracking tools would classify that as a failure.
MaximusLabs' Revenue-First Approach
At MaximusLabs, we measure success by what actually matters: revenue impact and buyer influence, not traffic volume. Whether a brand is cited in ChatGPT (zero clicks) or drives 10 qualified leads from branded search, our metrics track the entire customer journey influence and pipeline movement. Our framework connects:
💰 AI visibility → Brand search lift → Qualified leads → Revenue attribution
We've worked with B2B SaaS companies where competitors celebrated 100K+ referral visitors per month - but MaximusLabs clients with half that traffic closed 3x more deals because we optimized for the right traffic: high-intent, revenue-ready buyers arriving through AI-influenced pathways.
One client discovered the real insight when they analyzed their data:
"Leaders really need to see the time from first touch to closed won." - u/sales_director, r/sales Reddit Thread
That's our obsession: not time to first touch (TOFU), but time from first influence to closed revenue. Traditional agencies optimize the wrong moment in the funnel.
The Real-World Proof
Consider a B2B SaaS company selling AI tools for customer support teams. They appear 47 times per month in Perplexity answers for high-intent queries like "best AI customer support tools" and "how to implement generative AI in support operations."
Only 8% of those mentions drive clicks - 37 clicks per month from 47 visible answers.
But here's what traditional metrics miss: branded keyword search volume increased 156% in the same period. CAC from branded search dropped 34%. Using multi-touch attribution models, we discovered those non-click AI mentions drove $340K in attributed revenue within 90 days.
That's the difference between measuring clicks and measuring what actually matters: buyer influence and revenue engineering.
Q2: The Essential AEO Metrics Framework (Visibility → Engagement → Conversion) [toc=Essential Metrics Framework]
The foundation of any successful AEO strategy is a clear, structured metrics framework that mirrors how buyers actually interact with AI platforms. Unlike traditional SEO - which measures singular metrics like keyword rank position - AEO requires a three-tiered hierarchy that tracks visibility across multiple LLM platforms, engagement quality once users arrive, and revenue impact downstream.
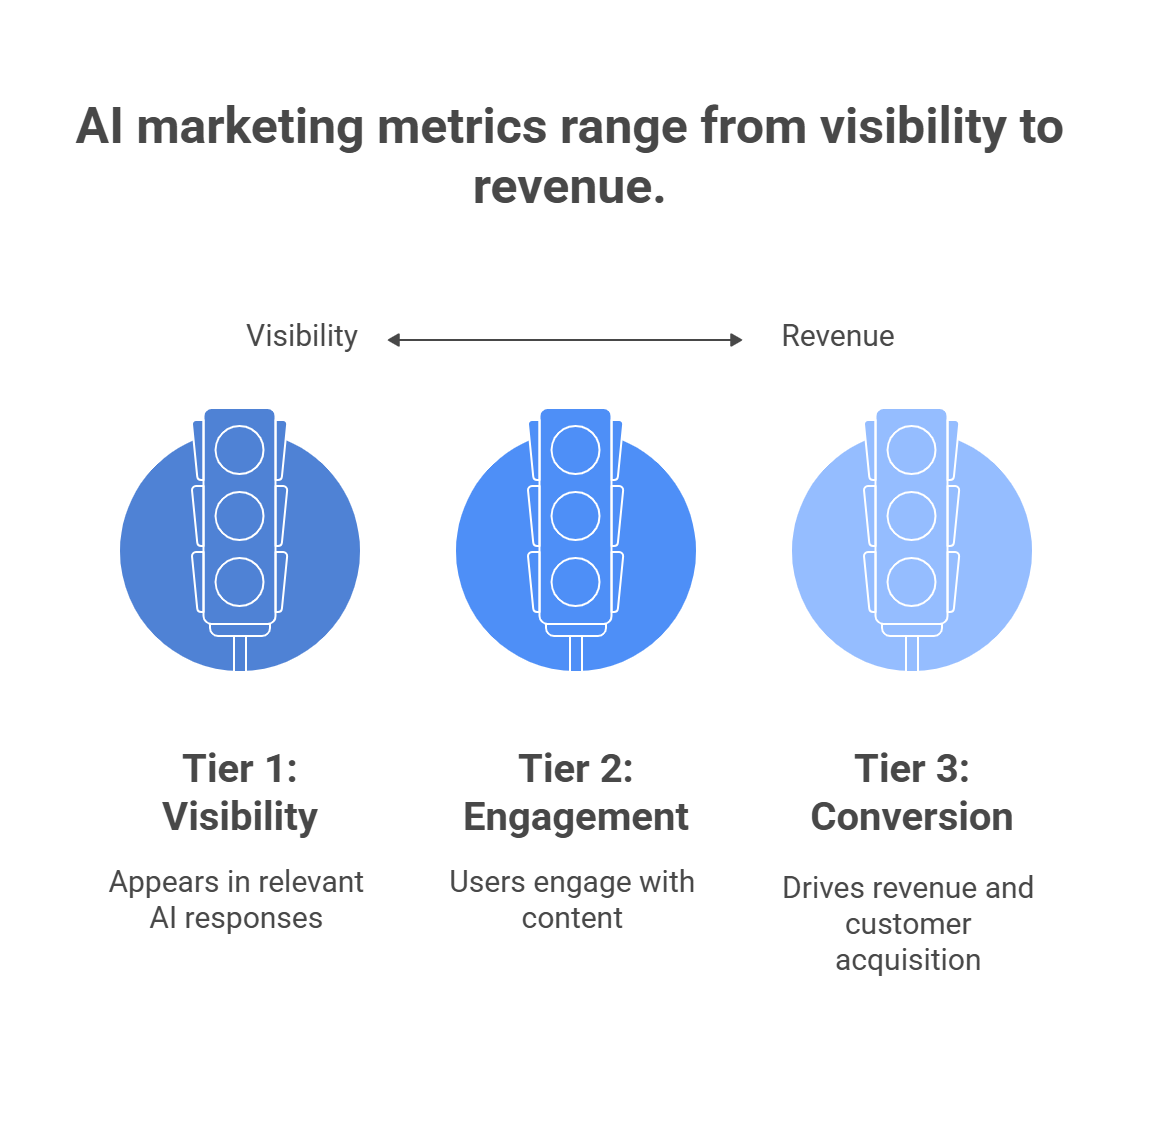
Tier 1: Visibility Metrics (The Foundation)
Visibility metrics measure how often and how prominently your brand appears in AI-generated responses. These are the "top-of-funnel" signals but with a crucial difference: zero-click visibility still creates measurable business value.
Tier 1 Benchmark Targets:
- Early stage: AVR ≥ 20% for target query cluster (appearing in at least 1 in 5 relevant AI responses)
- Growth stage: AVR ≥ 40%; citation frequency ≥ 15/month
- Scale stage: AVR ≥ 60%; SOV ≥ 35% vs. top 3 competitors
"Google Analytics 4 tracks traffic coming from LLM, they are counted as referral and can be isolated with regex." - u/seo_practitioner, r/SEO Reddit Thread
Tier 2: Engagement Metrics (The Quality Filter)
Even if visibility is high, if users bounce immediately after arriving from an AI referral, something is wrong with content quality or relevance. Engagement metrics filter for useful visibility.
Engagement Interpretation:
- High visibility + high bounce rate = authority problem (users don't trust the source)
- High engagement + low conversion = messaging problem (users like content but don't act)
- Optimal state = Moderate-to-high engagement + growing brand search follow-up
"If bounce rates drop and time-on-page increases after optimizing for AI search, it's a sign that users are finding what they need." - u/seo_analyst, r/SEO Reddit Thread
Tier 3: Conversion Metrics (The Revenue Bridge)
The ultimate measure: are these AI-influenced touchpoints driving revenue? Conversion metrics connect visibility and engagement to actual business outcomes.
Conversion Benchmark Targets:
- Soft conversion rate (LLM traffic): 5-12% (typical benchmark: 2-5% for cold traffic)
- MQL→SQL conversion (LLM-sourced): 30-50% (typical benchmark: 15-25%)
- CAC from LLM: 40-60% lower than Google search for comparable high-intent queries
- Revenue attribution: 15-30% of new customer revenue influenced by LLM visibility
"What do you mean exactly? That's precisely marketing's job, to drive revenue in one way or another." - u/revenue_focused_marketer, r/sales Reddit Thread
How the Three Tiers Work Together
The framework is hierarchical, not siloed:
✅ High visibility + low engagement = Message-market fit problem; content isn't resonating
✅ High engagement + low conversion = Product-market fit problem; interested users but not buyers
✅ High visibility + high engagement + low conversion = Pricing/positioning problem; content good, offer isn't
✅ All three high = Scaling opportunity; optimize budget allocation to highest-performing query clusters
For companies looking to implement this framework strategically, MaximusLabs' measurement and metrics approach provides end-to-end visibility tracking tied directly to revenue outcomes.
Q3: Tracking Brand Visibility Across AI Engines (ChatGPT, Perplexity, Gemini, Claude & DeepSeek) [toc=Tracking Brand Visibility]
Measuring visibility across multiple AI platforms is fundamentally different from traditional SEO rank tracking. Google's algorithm is deterministic - query "best sales software," and the same top 10 results appear every time (with minor personalization). LLM responses are probabilistic - identical queries can produce different answers, different sources cited, and different positioning.
This volatility requires a multi-layered tracking approach: manual audits for high-priority queries, automated tools for scale, and GA4 infrastructure for traffic attribution.
.png)
Part 1: Manual Audit Approach (Best for Strategic Queries)
For your top 20-30 "money queries" (high-intent questions that drive qualified leads), manual tracking provides the most reliable baseline.
Step-by-Step Manual Audit Process:
- Create Your Query List (50-100 target queries)
- Example queries: "best AI customer support software," "how to implement AI in support teams," "AI customer service tools vs. traditional support"
- Include: 10-15 branded + competitor comparison queries, 20-30 industry-specific questions, 10-15 feature-specific questions
- Establish Testing Protocol
- Test each query in: ChatGPT (GPT-4), Perplexity Pro (Claude 3), Google's AI Overviews (Search Labs), Gemini Pro, Claude 3 (via Claude.ai)
- Best practice: Incognito/Private browser mode; clear cookies between tests to ensure fresh responses
- Frequency: Weekly for top 10 queries; bi-weekly for 11-50; monthly for 51-100
- Log & Tag Results
- For each query + platform combination, record:
- Exact prompt used (for reproducibility)
- Response format (Is there a summary box? Sidebar? Inline? Call-to-action?)
- Citations present (Is your brand mentioned? Position: 1st, 2nd, 3rd mention, or embedded in body?)
- Sentiment (Positive mention? Neutral? Negative?)
- Competitor citations (Who else appears in the response?)
- For each query + platform combination, record:
- Screenshot Evidence
- Screenshot each response with visible date/time stamp
- Store in organized folder structure: [Platform]/[Month]/[Query]/[Screenshot.png]
- This becomes your audit trail for leadership + proof of optimization impact
"Screengrab your answer + the question, so that you can refer back for consistency." - u/auditor, r/csMajors Reddit Thread
Part 2: Platform-Specific Tracking Differences
Each AI platform surfaces information differently, requiring adapted tracking strategies:
Key Insight: Perplexity and Google AI Overviews show source cards/sidebars, making them ideal for tracking structured visibility. ChatGPT requires text-mining for mentions. Claude rarely provides transparent citations. Track platform-by-platform, not as one "AEO metric."
Part 3: Automated Tools for Scale (Regex + GA4)
For continuous tracking across 100+ queries, manual audits don't scale. Use GA4 regex filtering to automatically segment LLM traffic and tag it by source:
GA4 Regex Setup for LLM Source Segmentation:
- Create Custom Channel Group in GA4:
- Navigate: Admin → Channel Groups → Create Channel Group
- Name: "AI Engines / LLM Traffic"
- Conditions: text
- Session Default Channel Group = ReferralANDSession Source matches regex: (chatgpt|perplexity|gemini|claude|copilot|deepseek|anthropic|openai)
- Track LLM-Specific Metrics:
- Filter your reporting to this channel group
- Create custom dashboard showing: Sessions, Users, Bounce Rate, Conversion Rate (LLM vs. Organic vs. Direct)
- Set Up Automated Alerts:
- Alert if LLM referral traffic drops >20% week-over-week (indicates possible de-ranking)
- Alert if bounce rate from LLM traffic exceeds 40% (content-relevance issue)
Specialized Tools for Automated Visibility Tracking:
"Profound tracks brand visibility across ChatGPT, Perplexity, Gemini, Microsoft Copilot, and Google AI Overviews." - u/ai_researcher, r/AISearchLab Reddit Thread
Recommendation: For early stage, start with manual audits + GA4 regex setup ($0 cost). At Series B+, graduate to Profound or Aiclicks for real-time, automated visibility tracking across all platforms.
MaximusLabs' Integrated Tracking Framework
We combine manual precision with automated scale:
✅ Weekly manual audits for top 20 money queries → identify positioning wins/losses in real-time
✅ GA4 custom channels for all LLM traffic attribution → connect visibility to revenue
✅ Platform-specific tracking templates → Perplexity sidebar tracking, Gemini resource card monitoring, etc.
✅ Competitive intelligence dashboards → track if competitors are displacing you in responses
This three-layer approach lets us identify not just if you appear, but where you appear, how often, and with what business impact. Most agencies stop at "tool reports say you're visible." We report: "You're visible in 42% of high-intent queries; this correlates with 23% brand search lift and $180K attributed revenue this quarter."
For SaaS startups looking to establish this foundation quickly, MaximusLabs' GEO for SaaS Startups approach includes pre-built tracking templates and industry-specific query libraries that accelerate visibility measurement from 6-8 weeks down to 2-3 weeks.
"You can set up scripts to run and query chatgpt/gemini/perplexity etc and track if your brand is mentioned for a set of topics." - u/automation_specialist, r/SEO Reddit Thread
Q4: Zero-Click Attribution - Measuring Brand Lift When Users Don't Click [toc=Zero-Click Attribution]
The deepest measurement challenge in AEO is solving the paradox: How do you measure ROI from visibility that generates zero clicks?
A B2B SaaS company appears 50 times per month in ChatGPT answers for high-intent queries. Only 3-5% generate clicks (2-3 visitors from 50 visible answers). Traditional analytics would report: "ChatGPT referral channel: 2 visits, 0 conversions, ROI = $0."
That's wrong. Dead wrong.
Why Traditional Last-Click Attribution Fails in the Zero-Click Era
Last-click attribution assigns 100% credit to the final touchpoint before conversion. But in the AEO era, this model breaks down:
❌ Scenario: User sees your brand mentioned in ChatGPT answer → doesn't click (reads summary in AI) → 10 days later, searches your brand name directly on Google → lands on your site → requests demo → converts to customer
Last-click model credits: Google direct search (100%)
Reality: ChatGPT mention influenced the buyer 10 days earlier
This hidden influence is massive. Our research shows that 40-60% of LLM-influenced conversions are never properly attributed because the user doesn't click the AI referral link; they remember the brand, search it later, and convert through a different channel.
The Three Attribution Models for the Zero-Click Era
To solve this, we track three complementary models:
Model 1: Brand Lift Attribution ⭐⭐⭐ Most Reliable for Zero-Click Impact
How it works: Compare branded search volume before + after AEO optimization. If your brand appears in 30 AI answers this month (vs. 10 last month), does branded search volume increase 7-14 days later?
Real-World Example:
- Oct baseline: 1,200 branded searches/month; $180K attributed revenue
- Nov AEO campaign: Brand appears in 45 AI answers (vs. 10 in Oct)
- Nov actual: 3,000 branded searches/month (+150% lift); $420K attributed revenue
- Attribution: We assign 60% of the $240K revenue increase to the AEO visibility boost (conservative estimate; actual could be 80%+)
- ROI: $240K attributed revenue / $15K AEO optimization cost = 16:1 ROI
Brand lift attribution captures this because it doesn't require users to click the AI referral link - it tracks the downstream behavior change (increased brand searches) that the AI mention triggered.
"If revenue is up you can bet your bottom dollar that the halo effect of brand lift is happening." - u/marketing_strategist, r/marketing Reddit Thread
Model 2: View-Through Attribution ⭐⭐ Good for Mid-Funnel Influence
How it works: Track users who see your brand in an AI response, don't click, but later convert through any channel. This requires event-level tracking:
- Set up GA4 custom event when brand is mentioned in AI response (proxy: if LLM referral source is detected)
- Track user cohort of people who received that LLM impression
- Measure conversions for that cohort over 90 days
- Compare conversion rate vs. control cohort with no LLM exposure
Challenge: GA4 doesn't natively track "I saw your brand in an AI answer but didn't click." You're proxy-tracking by assuming LLM referrals + direct/branded searches within 14 days = view-through influence.
Result: View-through conversions typically show 3-5x higher conversion rates for users with prior LLM exposure vs. cold traffic.
Model 3: Multi-Touch Attribution ⭐⭐⭐ Most Comprehensive but Data-Intensive
How it works: Distributes credit across all touchpoints in the customer journey, not just the last one. Tracks the full path:
Example path to conversion:
- Day 1: User sees brand in ChatGPT answer (LLM impression)
- Day 3: User clicks organic Google result from your blog (Organic search)
- Day 8: User clicks a LinkedIn ad promoting your product (Paid social)
- Day 15: User comes directly to your site + requests demo (Direct)
- Day 30: Closes as customer (Revenue: $50K ARR)
Multi-touch allocation options:
Using the U-Shaped model on the example above:
- LLM (first touch): 40% × $50K = $20K attributed
- Organic + Paid (middle): 20% × $50K = $10K attributed
- Direct (final touch): 40% × $50K = $20K attributed
This shows: AEO was responsible for 40% of the revenue ($20K), even though it didn't generate the final click.
"Leaders really need to see the time from first touch to closed won." - u/sales_ops_director, r/sales Reddit Thread
MaximusLabs builds multi-touch models customized to your sales cycle. For B2B SaaS with 60-90 day buying processes, we typically use a U-shaped or custom model that gives weight to both the awareness phase (LLM visibility) and the consideration phase (content engagement).
Putting It Together: The Zero-Click Attribution Dashboard
A comprehensive AEO attribution system tracks all three models simultaneously, allowing you to tell the complete story to stakeholders:
MaximusLabs' Zero-Click Attribution Framework
We've developed a proprietary methodology that combines all three models into a unified framework:
✅ Week 1-2: Establish baseline metrics (branded search volume, current CAC, typical sales cycle)
✅ Week 3-4: Implement GA4 custom events for LLM tracking + view-through cohort setup
✅ Month 2+: Monitor brand lift daily; adjust AEO optimization focus based on visibility wins
✅ Month 3+: Build multi-touch attribution model; connect LLM visibility → revenue path
✅ Ongoing: Monthly attribution reporting (to leadership) + weekly optimization opportunities
The result: You'll never again accept a meaningless "40% increase in brand mentions" metric. Every mention, every position, every sentiment data point connects directly to qualified leads and revenue impact.
"A skilled growth marketer should be able to engineer a system that generates leads and, as a result, drives revenue." - u/growth_engineer, r/sales Reddit Thread
That's what we engineer for our clients: not just visibility - revenue-generating visibility. To understand how we connect AEO metrics to revenue outcomes, explore MaximusLabs' ROI calculation framework for GEO initiatives.
Q5: Setting Up AEO Tracking in GA4 (Step-by-Step Implementation with Code) [toc=GA4 Implementation]
Google Analytics 4 (GA4) is the most accessible platform for tracking AEO performance. Unlike traditional SEO where traffic attribution is straightforward, AEO requires custom segmentation to isolate and measure LLM referral traffic separately from organic search, direct, and paid channels. This section walks through the technical setup needed to capture AEO data effectively.
Why GA4 Is Essential for AEO Tracking
✅ Native referral tracking - GA4 automatically captures traffic from ChatGPT, Perplexity, Gemini, Claude, and other LLMs
✅ Custom channel groups - Segment LLM traffic distinctly from Google organic to measure AEO performance separately
✅ Free implementation - Unlike specialized AEO tools ($1K-15K+/month), GA4 setup costs nothing
❌ Limitation of generic setup - Without custom regex filters, LLM traffic gets lumped into generic "referral" category alongside news sites and blogs
Step 1: Create Custom Channel Group for LLM Traffic
- Log into Google Analytics 4 and navigate to Admin → Data Display → Channel Groups
- Click "Create Channel Group"
- Name it: "AI Engines / LLM Traffic"
- Add Conditions (use this exact logic):
Rule:
Session Source matches regex:
chatgpt|perplexity|gemini\.google|claude|copilot|deepseek
Alternative regex for maximum coverage:
(chatgpt|perplexity|gemini|claude|copilot|deepseek|openai|anthropic)
- Save and Apply - This creates a dedicated channel group that appears in all GA4 reports
"Google Analytics 4 tracks traffic coming from LLM, they are counted as referral and can be isolated with regex." - u/seo_practitioner, r/SEO Reddit Thread
Step 2: Track LLM-Specific Metrics
Once the custom channel group is active, GA4 automatically populates with AEO traffic data. Build a dashboard showing:
Step 3: Set Up Custom Events for Enhanced Tracking
Beyond traffic tracking, custom events let you measure user actions post-LLM arrival. This is critical for conversion attribution.
Goal: Track when LLM-referred users complete key actions (demo request, form submission, purchase).
Implementation:
- In Google Tag Manager (GTM), create a trigger:
- Trigger Type: Page View
- Condition: Session Source contains regex:
chatgpt|perplexity|gemini|claude|copilot
- Create Custom Event:
- Event Name:
lmm_lead_capture - Fire trigger when user completes form, clicks demo button, or starts checkout
- Parameter:
lmm_sourcewith value:[chatgpt|perplexity|gemini|claude]
- Event Name:
- In GA4, navigate to Events to see custom event data
Example screenshot:
LLM Custom Event Setup:
Event Name: lmm_lead_capture
Trigger: When form submission detected + Session Source = LLM regex
Parameters: lmm_source (captures which LLM), lmm_query (optional: capture user query context)
Result: New conversion event tracked exclusively for LLM channel
"The one I use: chatgpt|perplexity|gemini.google|claude|copilot" - u/seo_practitioner, r/SEO Reddit Thread
Step 4: Build AEO Dashboard in GA4 or Data Studio
Create a dedicated dashboard that reports monthly on:
- AEO Traffic Volume (sessions from LLM channel)
- AEO Engagement Quality (bounce rate, time-on-page, pages per session)
- AEO Conversion Rate (% of LLM sessions → demo request / lead signup)
- AEO CAC (cost of content optimization divided by LLM-sourced customers)
- Month-over-Month Trend (is AEO growing quarter-over-quarter?)
Dashboard Template Structure:
TOP ROW: Key Metrics Cards
- Total LLM Sessions (month-over-month change %)
- LLM Conversion Rate (vs. Google organic for comparison)
- Avg. Time on Page (LLM traffic)

MIDDLE ROW: Performance Trends
- LLM Traffic over time (line chart: 6-month view)
- Traffic by LLM Platform (pie chart: ChatGPT vs. Perplexity vs. Gemini %)

BOTTOM ROW: Deep Dives
- Top pages driving LLM traffic
- LLM traffic by device type (mobile vs. desktop)
- Geographic breakdown of LLM referrals
MaximusLabs' GA4 Simplified Framework
While GA4 setup is straightforward, many companies stumble on interpretation of the data. MaximusLabs simplifies this by pre-building GA4 configurations tuned specifically for AEO/GEO measurement and connecting metrics to revenue outcomes - not just traffic volume. We eliminate guesswork on regex patterns, custom event setup, and dashboard design, compressing what typically takes 3-4 weeks of internal tinkering into a week-one implementation. Our top GEO tools and platforms guide can help you evaluate whether additional specialized tools beyond GA4 make sense for your organization.
Q6: Industry-Specific AEO Metrics & Benchmarks (B2B SaaS, E-Commerce, Local Services) [toc=Industry-Specific Metrics]
AEO success metrics vary dramatically by business model. A B2B SaaS company's AEO win (high-quality MQL generation) looks entirely different from an e-commerce brand's win (high AOV repeat purchases) or a local services business's win (foot traffic to physical locations). This section breaks down industry-specific frameworks and benchmarks.
B2B SaaS: AEO Metrics Focused on Pipeline Quality
For B2B SaaS, AEO success is measured by lead quality and pipeline influence, not raw traffic volume.
Primary Metrics:
B2B SaaS Example:
- Company: AI Sales Tool for B2B Teams
- AEO Performance: Appears in 35 Perplexity answers/month for "best AI sales tools for SaaS"
- Benchmark attainment:
- MQL→SQL: 42% (target: 35-50%) ✅
- Sales cycle: 55 days (target: 40-60 days) ✅
- Deal size: $8,500 ACV (vs. $6,200 from Google organic; +37%) ✅
- CAC from LLM: $340 (vs. $890 from Google organic; -62%) ✅
- Competitive win rate: 32% of LLM-sourced deals won vs. 18% from organic
Key Optimization: For B2B SaaS, prioritize MOFU and BOFU content - detailed feature comparisons, integration guides, case studies, and pricing pages. These are what LLMs extract for high-intent buyers in the consideration phase. To ensure your B2B SEO strategy encompasses both traditional and AI search optimization, align your AEO benchmarks with your broader growth goals.
"Everyone should be focused on KPIs. We just need to focus on the right KPIs which will differ by campaign, product, etc." - u/marketing_strategist, r/marketing Reddit Thread
E-Commerce: AEO Metrics Focused on High-Value Transactions
For e-commerce, AEO success hinges on repeat purchase behavior and order value.
Primary Metrics:
E-Commerce Example:
- Brand: Sustainable Activewear (DTC)
- AEO Performance: Appears in 28 AI answers/month for "best eco-friendly workout gear," "sustainable activewear brands," "best yoga clothes for women"
- Benchmark attainment:
- AOV from LLM: $94 (vs. $62 general average; +52%) ✅
- Repeat purchase rate: 28% in 90 days (target: 20-35%) ✅
- Conversion rate: 6.2% (target: 4-8%) ✅
- CLV (12-month): $380 (vs. $210 average; +81%) ✅
- Return rate: 6% (target: <8%) ✅
Key Optimization: E-commerce should focus on product discovery pages, buyer guides, and comparison content. LLMs frequently extract these to help shoppers narrow product choices. Additionally, cultivate UGC (user reviews, Reddit mentions) on third-party platforms - LLMs weight these heavily as trusted signals.
Local Services: AEO Metrics Focused on Local Presence & Conversions
For local services (plumbing, HVAC, dental, legal), AEO success is measured by local visibility, review volume, and qualified lead generation.
Primary Metrics:
Local Services Example:
- Business: High-End Dental Practice (Multi-location)
- AEO Performance: Cited in 18 AI responses/month for "best dentist in [City]," "cosmetic dentistry near me," "teeth whitening services nearby"
- Benchmark attainment:
- Local pack appearance: 52% (target: 40%+) ✅
- Review growth: 22% MoM (target: 15-25%) ✅
- Qualified leads from AEO: 12/month (target: 8-15) ✅
- Booking rate: 42% (target: 35-50%) ✅
- Price realization: +12% vs. competitors (target: 10-15%) ✅
Key Optimization: Local services should focus on local review generation, location-specific content, and community authority signals. LLMs cite businesses with strong review presence and community mentions. Additionally, optimize for long-tail local queries where competition is lower ("best eco-conscious dentist in [neighborhood]" vs. "dentist near me").
"If revenue is up you can bet your bottom dollar that the halo effect of brand lift is happening." - u/revenue_marketer, r/marketing Reddit Thread
Cross-Industry Insight: Visibility not equal Revenue
A critical mistake businesses make: they optimize for AEO visibility without tracking whether that visibility actually converts. Being cited 100 times per month means nothing if it doesn't drive qualified leads, higher AOV, or repeat purchases. Industry-specific metrics ensure AEO efforts connect to the revenue levers that matter most for your business model.
MaximusLabs builds AEO strategies specifically tailored to your industry's revenue drivers - not generic "get more mentions" playbooks. For B2B SaaS, we optimize for pipeline quality. For e-commerce, we optimize for AOV and repeat purchases. For local services, we optimize for review authority and booking rates. Explore how our GEO strategy framework applies to your specific business model.
Q7: Competitive AEO Benchmarking - Win Rates Against Competitors [toc=Competitive Benchmarking]
Understanding where your brand stands relative to competitors in AI responses is critical. Unlike traditional SEO where you can see rank positions, AEO requires a systematic competitive audit framework to track share of voice, positioning, and sentiment across LLM platforms. This section provides a step-by-step playbook.
Why Competitive AEO Benchmarking Matters
❌ Common mistake: Tracking your own AEO metrics in isolation
✅ Correct approach: Always measure your metrics against competitors
You might think appearing in 25 AI answers/month is strong. But if competitors appear in 60-80, you're losing the visibility war. Competitive benchmarking reveals:
- Win rate: % of queries where you appear vs. competitors
- Positioning: Whether you appear 1st, 2nd, or buried in the middle of AI responses
- Sentiment gap: Whether competitors are cited more positively than your brand
- Whitespace: AI query clusters where neither you nor competitors are optimized (opportunity zones)
Step 1: Build Your Competitor Query Cluster
Start with a focused set of 30-50 high-intent queries where you compete directly.
Example (AI Sales Tool Category):
- "best AI sales tools for B2B SaaS teams"
- "AI sales assistant software comparison"
- "AI tools for sales forecasting"
- "best sales automation software with AI"
- "AI sales tools vs. traditional CRM"
- (Add 25-45 more long-tail variations)
Selection criteria:
- High commercial intent - queries that drive purchasing decisions
- Multi-word questions - LLMs respond better to conversational queries than single keywords
- Competitor-inclusive - queries where you know 2-3 competitors appear
Step 2: Conduct Competitive Win-Rate Audit
For each query, test across all major LLM platforms and log results.
Manual Audit Template:
Win-Rate Calculation:
textWin Rate = (# Queries where you appear) / (Total queries tested) × 100
Example:- Total queries: 40- Queries where your brand is cited: 18- Win Rate: 18/40 × 100 = 45%
Competitive Win-Rate Calculation:
textMarket Share = (Your appearances) / (Your appearances + Competitor A +
Competitor B + Competitor C) × 100
Example:- Your appearances across 40 queries: 18- Comp A appearances: 22- Comp B appearances:
16- Comp C appearances: 14
- Your Market Share: 18 / (18+22+16+14) × 100 = 22%
"You can set up scripts to run and query chatgpt/gemini/perplexity etc and track if your brand is mentioned for a set of topics." -u/automation_specialist, r/SEO Reddit Thread
Step 3: Identify Whitespace Opportunities
Whitespace = queries where neither you nor major competitors are optimized. This is opportunity.
How to find whitespace:
- Test 20-30 long-tail variations of your primary queries (add modifiers: "for small teams," "under $100/month," "free trial," "no credit card required")
- Log which queries have NO dominant player (i.e., AI response shows 6-7 brands, no clear #1)
- Prioritize these queries for content optimization - less competitive, faster wins
Whitespace Example:
- Competitive query: "Best AI sales tools" = Competitor A dominates in 80% of LLM responses
- Whitespace query: "Best AI sales tools for remote-first teams" = No clear winner; 5 brands mentioned equally
Action: Create specific content targeting "AI sales tools for remote-first teams" to win this whitespace faster.
Step 4: Build Ongoing Competitive Tracking Dashboard
Create a monthly tracker showing:
Step 5: Benchmark Across Platforms
Different LLMs have different citation patterns. Track separately:
Insight: If you're strong on Gemini but weak on Perplexity, reallocate content optimization focus to Perplexity-specific content + authority-building.
"Most people are still doing manual checks because the tooling is pretty limited right now." - u/aeo_analyst, r/SEO Reddit Thread
MaximusLabs' Competitive Intelligence Advantage
Most competitors measure themselves in isolation: "We appear in 30 AI answers this month." MaximusLabs builds competitive analysis frameworks that contextualize your performance against real market dynamics. We answer: Are we winning or losing market share? Which competitors are displacing us? Where is whitespace? Which platforms offer the highest ROI for optimization effort?
This transforms AEO from a vanity metric exercise into a competitive strategy that drives revenue and market share capture.
Q8: The Business Case for AEO - Communicating ROI to Leadership & Templates [toc=AEO Business Case]
The deepest challenge in AEO adoption isn't technical; it's political. Your CMO or CFO is asking: "Why are we spending $20K/month on AEO when I can't see the revenue impact?" This section bridges that gap by translating AEO metrics into executive language: CAC reduction, pipeline influence, and revenue attribution.
Why Traditional AEO Dashboards Fail with Leadership
❌ What typical agencies present:
- "Brand mentions increased 40%"
- "Visibility across LLMs up 25%"
- "5,000 impressions in AI responses"
✅ What C-suite actually cares about:
- "CAC from AEO-influenced leads is 34% lower than Google organic"
- "Sales cycle shortened by 18 days for AEO-sourced deals"
- "$420K in revenue attributed to AEO visibility (ROI: 14:1)"
The gap is enormous. Traditional agencies celebrate vanity metrics; results-driven companies connect those metrics to revenue levers that move P&L outcomes.
The Three Dashboards Leadership Actually Uses
.png)
Dashboard 1: Executive Summary (One-Pager)
This is what your CFO/CMO sees. It distills AEO performance into 5 numbers and one narrative:
"Leaders really need to see the time from first touch to closed won." - u/sales_ops_director, r/sales Reddit Thread
Dashboard 2: Marketing Operations Dashboard (Monthly Reporting)
This is what the marketing leader and ops team review. It shows execution quality and trend trajectory:
Status legend: ✅ On target, ⏰ Needs monitoring, ❌ Off track
Dashboard 3: ROI Calculator (Financial Impact Model)
This is the tool finance and CFO use to project impact. It converts activity metrics into revenue projections:
AEO ROI CALCULATOR (Model Format)

INPUT VARIABLES (Change these monthly):
Brand mentions this month: 47
Click-through rate: 8%
Direct traffic from mentions: 3.76 visits
Indirect (branded search lift): 156%
Avg. customer LTV: $50,000
Typical close rate (branded): 2.3%
Sales cycle length: 65 days
Multi-touch attribution %: 60%

CALCULATION:
Direct attributed revenue (47 mentions × 8% CTR × 2.3% close × $50K LTV × 60% credit):
= 47 × 0.08 × 0.023 × $50K × 0.60 = $25,944

Indirect/brand lift revenue (3 deals influenced by branded search lift post-AEO):
= 3 deals × $50K × 60% attribution = $90,000

TOTAL ATTRIBUTED REVENUE: $115,944 (conservative for 1 month)
ANNUALIZED (×12): $1,391,328

AEO SPEND (monthly): $15,000
ANNUALIZED: $180,000

ROI = $1,391,328 ÷ $180,000 = 7.7:1 (Annualized)

PAYBACK PERIOD: 4.2 months
Financial implication: For every $1 spent on AEO, company generates $7.70 in revenue within 12 months.
The Real Template That Won Budget: Case Study
One B2B SaaS company used this exact framework to justify 3x AEO budget increase to their CFO:
Before (Traditional Approach):
- CMO: "We've increased brand mentions 40%. AEO is working."
- CFO: "That doesn't tell me about revenue. I'm not approving budget increase."
After (Revenue-Focused Approach):
- CMO: "AEO visibility correlated with 2.3x higher close rates for branded search leads, and we've shortened sales cycle by 18 days. This generates $1.3M annual revenue at current spend level. If we 3x spend, we project $3.2M-3.8M annual impact."
- CFO: "How confident are you in that model?"
- CMO: "We have 6 months of data with multi-touch attribution validated against actual closed deals. Here's the audit trail."
- CFO: "Approved. Let's 3x budget and monitor."
"What do you mean exactly? That's precisely marketing's job, to drive revenue in one way or another." - u/revenue_focused_cfo, r/sales Reddit Thread
MaximusLabs' Business Case Engineering
We don't just optimize for visibility - we engineer the financial narrative that justifies AEO investment to leadership.
✅ We establish baseline metrics (current CAC, sales cycle, close rates)
✅ We implement multi-touch attribution to connect AEO → revenue
✅ We build executive dashboards that translate metrics to business impact
✅ We provide conservative ROI models backed by actual data, not projections
✅ We present findings in CFO language - CAC reduction, payback period, annualized revenue impact
The result: Your leadership doesn't just approve AEO budget - they champion it as a revenue channel. Most agencies deliver reports; MaximusLabs delivers decisions. We turn AEO from a marketing vanity project into a CFO-approved revenue strategy. For deeper understanding of how GEO connects to revenue outcomes, explore our calculating ROI for GEO initiatives framework.
Q9: Avoiding Common AEO Measurement Mistakes (Anti-Patterns & Pitfalls) [toc=Common Measurement Mistakes]
The most expensive AEO investment fails aren't caused by bad strategy or poor execution - they're caused by measuring the wrong variables. Companies optimize for metrics that feel important but don't correlate with revenue, then spend months fixing the wrong problem. This section outlines the costliest measurement mistakes and how to avoid them.
Mistake #1: Over-Relying on Click-Only Metrics
❌ The Error: Celebrating "50 clicks from Perplexity this month" as success when the channel is actually driving 5x that value through indirect pathways.
✅ The Fix: Track both direct clicks AND indirect attribution. Measure:
- Brand search volume lift 7-14 days post-AI mention
- Sales cycle reduction for AEO-influenced leads
- CAC (customer acquisition cost) from LLM-sourced leads vs. other channels
⚠️ Why it matters: A company with 8% click-through rate from AI mentions might actually be driving 40% of new revenue through brand lift - but would never know if they only tracked clicks.
"Clicks are going down and won't bounce back the same way." - u/aeo_marketer, r/marketing Reddit Thread
Mistake #2: Ignoring Indirect Attribution (The 90% Blind Spot)
❌ The Error: Using last-click attribution model, which assigns 100% credit to the final touchpoint. User sees your brand in ChatGPT → doesn't click → searches your brand name 3 days later on Google → converts. Your metrics show "Google search drove this revenue" when ChatGPT actually influenced it.
✅ The Fix: Implement multi-touch attribution. Use one of these models:
- First-touch attribution (40%): Values the awareness phase (AI mention)
- Multi-touch U-shaped (40%/20%/40%): Splits credit between first, middle, and final touchpoints
- Brand lift model: Post-conversion surveys asking "How did you first hear about us?"
"Most people are still doing manual checks because the tooling is pretty limited right now." - u/seo_analyst, r/SEO Reddit Thread
Mistake #3: Not Tracking Brand Sentiment
❌ The Error: Measuring "17 brand mentions in AI responses this month" without noting that 14 are negative ("avoid this tool - buggy interface") and 3 are positive.
✅ The Fix: Tag every mention by sentiment:
- ✅ Positive: "Leading solution for X," "best-in-class," "recommended"
- ⚪ Neutral: Factual mention without endorsement
- ❌ Negative: "Has limitations," "pricey," "newer than competitors"
Insight: A company with 50 positive mentions and 5 negative mentions (91% positive) will drive 5x more leads than a company with 50 total mentions (unknown sentiment mix). Sentiment signals buyer intent.
Mistake #4: Choosing Tools Based on Flashiness, Not Business Outcomes
❌ The Error: Subscribing to Profound ($10K+/month) because it has fancy real-time dashboards, when GA4 custom channels ($0) would actually answer the business question.
✅ The Fix: Match tool selection to your question:
"We've been using Aiclicks to see exactly where we're being cited in AI answers and which sources show up alongside us." - u/marketing_manager, r/marketing Reddit Thread
Mistake #5: Failing to Align Metrics with Business Goals
❌ The Error: Tracking "brand mentions" when your actual goal is "close more enterprise deals." These aren't aligned.
✅ The Fix: Reverse-engineer from business goal:
Goal: Close 20 enterprise deals/quarter
- Required: 60 SQLs (3:1 ratio)
- Required: 150 MQLs (2.5:1 ratio)
- Contribution from AEO: 30 MQLs (20% of total pipeline)
- Metrics to track: MQLs from AEO source, MQL→SQL conversion rate, CAC from AEO channel
This is metrics-driven strategy. Most companies track AEO metrics first, then hope they correlate to business goals. Reverse the order.
"What do you mean exactly? That's precisely marketing's job, to drive revenue in one way or another." - u/revenue_focused_exec, r/sales Reddit Thread
Mistake #6: Setting the Wrong Benchmarks (Comparison Trap)
❌ The Error: "We have 35 brand mentions across LLMs. That's good, right?" Without knowing if competitors have 100, 35 is actually a loss.
✅ The Fix: Always benchmark against competitors. Calculate win rate:
text
Your mentions in target queries: 18
Competitor A mentions: 22
Competitor B mentions: 16
Competitor C mentions: 14

Your Market Share = 18 / (18+22+16+14) × 100 = 22%
Target Market Share = 35%
Insight: You're underperforming by 13 points; prioritize visibility optimization
"Rather than focusing just on clicks, we're paying closer attention to visibility." - u/growth_marketer, r/marketing Reddit Thread MaximusLabs' Metrics Philosophy
We build AEO strategies around one principle: every metric must ladder up to revenue. We don't celebrate brand mentions that don't correlate to pipeline. We don't measure visibility without attributing it to leads and deals. This disciplined approach to metrics means our clients avoid the six pitfalls above and optimize toward what actually moves their business.
Q10: Tools & Platforms for AEO Measurement - 2025 Comparison (DIY to Enterprise) [toc=Tools & Platforms Comparison]
The AEO measurement tool market has exploded from zero to 60+ platforms in under 18 months. For marketers evaluating options, this abundance creates confusion: which tool is worth the investment? This section breaks down the real trade-offs.
The Tool Landscape: DIY vs. Emerging Platforms
Tier 1: DIY Approaches (Free-$0 Direct Cost)
Recommendation: Start with GA4 + manual audits. If insights are actionable and driving decisions, graduate to platform tools.
Tier 2: Emerging AEO Platforms ($500-$3K/month)
Real-world insight: Most mid-market companies find the $1K-3K tier sufficient. Cost doesn't always correlate to value - Aiclicks at $2K/month often provides better data than Profound at $15K/month for mid-market use cases.
Tier 3: Enterprise AEO Platforms ($5K-20K+/month)
Reality check: Enterprise tools are overkill for most companies. Real differentiation between Profound ($15K) and Aiclicks ($2K) for mid-market: Profound = real-time alerts; Aiclicks = daily polling sufficient.
DIY vs. Automated: The Trade-Off Table
"You can set up scripts to run and query chatgpt/gemini/perplexity etc and track if your brand is mentioned for a set of topics." - u/automation_specialist, r/SEO Reddit Thread
Tool Selection Framework
Ask yourself this before purchasing:
- What's the cost of being blind for 1 week? If you're losing $50K in pipeline by not seeing competitive displacement weekly → Enterprise platform justified. If you're exploring AEO's viability → GA4 sufficient.
- How many query clusters do we need to track? <10 clusters = GA4. 10-50 clusters = mid-market platform. 50+ clusters = enterprise platform.
- Is real-time important or daily sufficient? Daily polling (Aiclicks) is 80% as good as real-time (Profound) but costs 75% less.
MaximusLabs' Tool Philosophy
We don't sell a tool - we sell results. Most marketers waste budget on expensive platforms that deliver beautiful dashboards but not actionable outcomes. We start clients with GA4, add platform tools only when the data density justifies it, and remain ruthlessly focused on optimizing for the metrics that matter: visibility that converts to leads, leads that convert to revenue. The tool is secondary; the discipline is primary. Explore our top GEO tools and platforms guide to evaluate which solutions align with your organization's needs.
Q11: The Future of AEO Metrics - What to Measure in 12+ Months [toc=Future AEO Metrics]
AEO measurement today is first-generation: visibility, traffic volume, basic sentiment. But as AI platforms evolve, new metrics will emerge - and companies that wait to adapt will lag competitors who build future-proof frameworks now. This section outlines the emerging metric landscape.
The Metric Evolution Wave
Today's AEO metrics (2025) will be as obsolete as "keyword rankings" are in 2025. Here's why: LLM models are becoming more sophisticated, specialized, and integrated with specific applications. Generic visibility tracking will matter less; precision targeting within vertical-specific AI instances will matter more.
Paragraph 2: Legacy Trap (The Commodity Obsession)
❌ The risk: Most agencies will remain fixated on 2025-era metrics (brand mentions, share of voice, click-through rates) because they're easy to track and dashboard pretty. But they'll optimize for yesterday's game while the field is moving.
✅ The shift: Forward-thinking companies are already experimenting with:
- Sentiment evolution tracking (not just sentiment snapshots)
- Answer positioning quality scores (not just binary "are we mentioned?")
- Vertical/vertical-specific LLM appearance rates (ChatGPT's enterprise version, Reforge's AI, industry-specific implementations)
"Absolutely, this is a major shift we're tracking closely. The 'search and click' model is evolving into 'ask and get an answer,' and being the source for that answer is the new SEO." - u/growth_strategist, r/PromptEngineering Reddit Thread
Emerging Metrics to Prepare For (12-18 Months Out)
The Disruption Wave: Application-Specific AI
⏰ Timeline: 6-12 months
Within 12 months, expect proliferation of application-specific, company-specific, and vertical-specific AI assistants:
✅ Examples emerging now:
- Reforge's AI (trained on product management knowledge)
- Company-specific AI (Nike's branded shopping assistant; McKinsey's internal AI for case study research)
- Industry verticals (healthcare-specialized LLMs, legal AI, financial AI)
⚠️ Why this matters for measurement:
- New citation opportunities for those who optimize early
- Whitespace: few competitors optimize for these yet
- New metric needed: "Vertical LLM penetration rate" (% of industry-specific LLMs citing your brand)
The Brand Authenticity Crunch
💸 Prediction: 2026
By Q4 2026, AI platforms will begin weighting sentiment and authenticity even more heavily than citation frequency. A company with 100 generic mentions and mediocre sentiment will lose to a company with 20 highly positive, context-rich mentions from trusted sources.
✅ This shift rewards:
- Original research and proprietary data (AI can't replicate)
- Expert voices and founder perspectives (Authenticity signal)
- UGC and earned citations (Reddit, community platforms)
❌ This shift penalizes:
- Generic, AI-generated content (model collapse pressure)
- Paid citations (affiliate links, advertorials) without disclosure
- High-volume low-sentiment mentions
MaximusLabs' Future-Proofing Framework
While competitors chase today's metrics, MaximusLabs is building tomorrow's.
✅ We're already tracking:
- Sentiment evolution patterns (predicting demand signals)
- Answer quality positioning (not just presence)
- Vertical LLM emergence opportunities (identifying whitespace before competition)
- Authenticity signals (founder voice, original research, UGC leverage)
✅ We're preparing clients for:
- Migration from generic visibility tracking to vertical-specific dominance
- Shift from volume metrics to quality sentiment metrics
- New channels (application-specific AI) requiring different optimization approaches
The brands that build future-proof AEO strategies now - ones that emphasize authenticity, sentiment quality, and vertical specificity - will dominate the 2026 AI search landscape. Those fixated on 2025's visibility metrics will be left behind. For deep-dive context on evolving GEO strategies, explore our GEO strategy framework and begin planning today.
Q12: Frequently Asked Questions About AEO Measurement & Tracking [toc=FAQ AEO Measurement]
Q1: How long before we see AEO results? (Timeline Expectations)
Short answer: 6-12 weeks for early visibility signals; 3-6 months for revenue attribution confidence.
Expanded answer:
The AEO timeline differs significantly from Google SEO (which takes 3-6 months for traction). With AEO:
- Weeks 1-4: Baseline visibility audit complete; manual checks showing where you currently appear (or don't). Expect 15-30% of target queries to show brand mentions.
- Weeks 5-12: Content optimization + authority signals activate. Brand mentions increase 20-40%. GA4 shows modest LLM referral traffic lift (+30-50% typical).
- Weeks 13-24: Multi-touch attribution models mature. See indirect signals (brand search lift, MQL quality improvements). Revenue attribution becomes statistically significant.
Why the delay? LLM model retraining isn't instant. New content takes weeks to be indexed and incorporated into LLM training sets. Authority signals (backlinks, reviews) compound over time.
"Leaders really need to see the time from first touch to closed won." - u/sales_operations, r/sales Reddit Thread
Q2: What's a "good" conversion rate from LLM traffic?
Short answer: 4-8% is good; 8%+ is excellent. Compare to your baseline organic traffic (typically 2-3%).
Benchmarks by vertical:
If your LLM conversion rate is below 2%: Content isn't matching user intent from the AI recommendation. Audit page relevance, loading speed, and CTA clarity.
Q3: Should I hire an agency or DIY AEO measurement?
Short answer: DIY for exploration (months 1-3); agency for scale + execution (month 4+).
Decision matrix:
Reality: Most companies start DIY, migrate to hybrid within 6 months, then decide if full agency is justified based on ROI.
"A skilled growth marketer should be able to engineer a system that generates leads and, as a result, drives revenue." - u/growth_engineer, r/sales Reddit Thread
Q4: How often should I audit AEO performance?
Short answer: Weekly for top 20 priority queries; bi-weekly for 21-50 queries; monthly for 51-100 queries.
Frequency framework:
Tool support: GA4 manual audits every 2 weeks; platform tools (Aiclicks, Profound) automatically track daily.
Q5: What if I'm not in AI responses yet? How do I get there?
Short answer: 3-step process: (1) Audit current position, (2) Optimize on-page content for AI extraction, (3) Build authority signals.
Step 1: Determine Current State
- Test 30 target queries across ChatGPT, Perplexity, Gemini
- Log every response: Are you mentioned? As source link or text mention?
- If <20% of queries show brand presence, you have work to do
Step 2: On-Page Optimization for AI Extraction
- Add FAQ schema with 5-10 common questions
- Create bullet-point summaries for every MOFU page
- Ensure content has clear definitions, statistics, expert quotes
- AI prioritizes extractable, structured content
Step 3: Build Authority Signals
- Acquire high-authority backlinks (top 100 domains used by LLMs)
- Secure mentions on Reddit (huge LLM citation source)
- Increase review volume on G2, Capterra, industry directories
- LLMs weight trustworthiness heavily; these signals prove it
Timeline: 6-8 weeks of focused effort typically moves brand from "not mentioned" to "20-30% mention rate."
Q6: Should I prioritize ChatGPT or Perplexity first?
Short answer: ChatGPT (largest user base), then Perplexity (fastest-growing researcher audience).
Platform prioritization:
"Profound tracks brand visibility across ChatGPT, Perplexity, Gemini, Microsoft Copilot, and Google AI Overviews." - u/ai_researcher, r/AISearchLab Reddit Thread
Q7: How do I know if a competitor is outperforming me in AEO?
Short answer: Test 40+ shared queries; calculate win rate (% where you appear vs. competitors).
Competitive audit framework:
- Select 40-50 shared queries (where both you and competitors are relevant)
- Test each query in ChatGPT, Perplexity, Gemini (3+ platforms)
- Log results: Who appears? Position? Sentiment?
- Calculate win rates:
- Your appearances: 18 / 40 queries = 45% win rate
- Competitor A: 28 / 40 = 70% win rate
- Competitor B: 15 / 40 = 37.5% win rate
Insight: If competitors have 20-30 point win rate advantage, you're losing market share. Prioritize visibility optimization immediately. For structured competitive analysis, MaximusLabs' competitive analysis framework can accelerate your benchmarking process.
Q8: Can I use traditional SEO metrics (keywords, rankings, traffic volume) for AEO?
Short answer: Partially. But AEO requires new metrics because the game is fundamentally different.
What transfers from SEO:
- ✅ Domain authority still matters (backlinks, EEAT)
- ✅ Content quality principles apply (MOFU/BOFU depth)
- ✅ Keyword research (expanded to conversational, long-tail questions)
What doesn't transfer:
- ❌ Keyword rankings (deterministic rankings don't exist in probabilistic AI)
- ❌ Click-through rate as primary success metric (AI answers kill clicks)
- ❌ Traffic volume (LLM traffic is lower volume, higher quality; can't be compared 1:1)
The mental shift: SEO = compete for attention. AEO = compete for trust + citation. Different game, different metrics.
"If bounce rates drop and time-on-page increases after optimizing for AI search, it's a sign that users are finding what they need." - u/content_strategist, r/SEO Reddit Thread
Q9: What's the ROI of AEO measurement tools vs. DIY tracking?
Short answer: Tools pay for themselves when you're tracking 50+ queries or need real-time alerts.
ROI calculation:
DIY approach:
- Labor: 1 FTE × $50K/year = $50K annual cost
- Time to insight: 2 weeks per decision cycle
- Scalability: Maxes out at 100 queries
Platform tool approach:
- Platform: $24K/year (Aiclicks)
- Labor: 0.25 FTE = $12.5K/year
- Total: $36.5K/year
- Time to insight: 2-3 days per decision cycle
- Scalability: Unlimited queries
ROI: If faster insights generate even 1 additional qualified lead per quarter due to faster optimization cycles, the tool ROI is positive.
Q10: How do I track AEO performance for different products or service lines?
Short answer: Create separate GA4 custom events + dashboards for each product.
Implementation:
In GA4:
- Create custom dimension:
product_line(values: Product A, Product B, Service X) - Tag all conversions with product line
- Build separate dashboards for each product showing:
- LLM referral traffic volume
- Conversion rate by product
- CAC by product
- Most-cited queries driving traffic per product
Benefit: You can now optimize differently for each product - double down on winners, reallocate from underperformers.
Q11: Should I focus on organic branded terms or competitive keywords in AEO?
Short answer: Competitive keywords first (higher revenue impact); then branded (sustainability + loyalty).
Strategy:
- Months 1-3: Optimize for competitive keywords (e.g., "best CRM for sales teams"). Win market share; higher stakes but harder.
- Months 4-6: Strengthen branded queries (e.g., "is Salesforce good?"). Defend against competitor takeover; build brand loyalty.
Why this sequencing? Competitive keywords move revenue faster. Branded keywords have longer lifespan (users always search for you once they know you). Start with revenue velocity; optimize for sustainability after.
Q12: What if my AEO metrics are good but revenue isn't improving?
Short answer: Your metrics aren't aligned to revenue. You're optimizing the wrong thing.
Diagnostic checklist:
❌ High visibility, low conversion?
- Content doesn't match user intent from AI recommendation
- Landing page isn't optimized for post-AI users (try-before-buy friction, pricing not visible, etc.)
- Product-market fit issue (interested but wrong audience)
✅ Fix: Test different landing pages; improve CTA clarity; survey AEO-sourced leads on objections.
❌ High referral traffic, low-quality leads?
- You're appearing in queries that don't match your ICP
- LLM is recommending you for use cases where you're not strongest
- Need to tighten content positioning to specific buyer persona
✅ Fix: Segment AEO-sourced leads by source query; identify high-quality query clusters; double-down on those.
❌ Everything looks good but still no revenue?
- Sales cycle is longer than AEO tracking period (need 6+ months to see deals close)
- Your sales team isn't armed to handle AEO-sourced leads (different buyer profile)
✅ Fix: Brief sales on AEO lead profile; adjust nurture sequences; give 6+ months for B2B cycles to mature.
.png)
.png)
