 Krishna Kaanth M
- B2B SEO returns roughly 702% to 748% ROI with break-even near month seven, and organic still drives about 44.6% of B2B revenue and 76% of site traffic.
- Zero-click searches reached 68.01% in 2026, but the damage splits by intent: 74.3% informational, 51.2% commercial, and 39.4% transactional.
- Google is not shrinking. Clickstream data shows roughly 21.6% volume growth in 2024 and about 373 times more searches than ChatGPT, falsifying the 25% decline forecast.
- Rank has decoupled from citation. After Gemini 3 shipped on January 27, 2026, top-10 reliance for AI Overview citations fell from about 76% to 38%.
- Brand mentions beat backlinks for AI visibility at r=0.664 versus r=0.218, and the G2 family now controls about 84% of B2B review-site citations.
- AI referrals are small but high intent: Webflow measured six times the conversion rate of Google organic, so Share of Answers and pipeline beat rank as metrics.
Q1. What do the 2026 B2B SEO statistics say about organic ROI and revenue contribution?
B2B SEO returns roughly 702% to 748% ROI, with break-even near month seven. Organic drives about 44.6% of B2B revenue and close to 76% of B2B site traffic. Cost per lead runs $31 to $147 against roughly $280 for paid search, and organic leads close at 14.6% versus 1.7% for outbound. The spread between published ROI figures reflects different measurement windows and attribution models, not contradictory realities.
Why every source hands you a different ROI number
📊 The three figures in circulation
Three numbers dominate B2B decks: 748%, 702%, and 22:1. They look like disagreements. They are the same phenomenon measured over different horizons, with different cohort sizes, and with different ideas about what counts as a conversion.
First Page Sage models ROI over a multi-year window, which rewards compounding. Ahrefs reports a tighter payback view, around 702% with a seven-month break-even for SaaS. Neither is wrong. They answer slightly different questions.
💰 The benchmark table your CFO will actually read
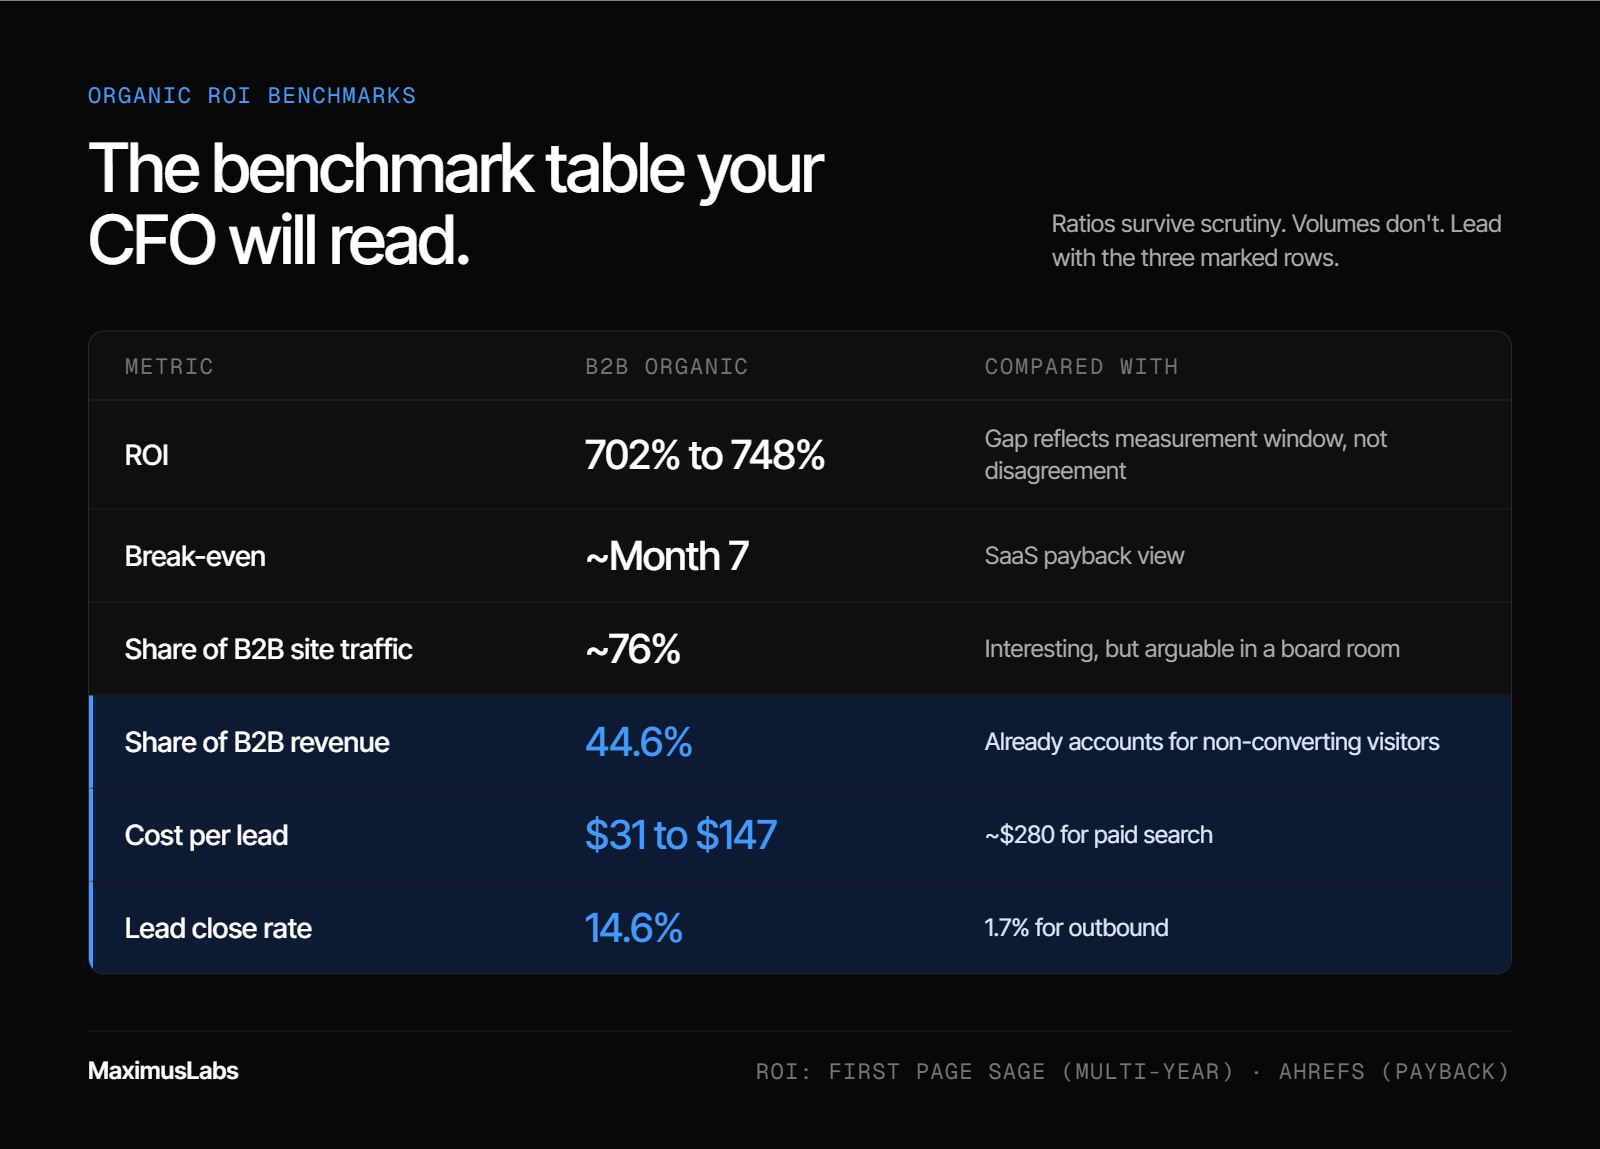
| Metric | Figure | Publisher, year |
| B2B SEO ROI (multi-year) | 748% | First Page Sage, 2025 |
| B2B SaaS ROI, break-even | 702%, ~7 months | Ahrefs, 2025 |
| Organic share of B2B revenue | 44.6% | SeoProfy aggregate, 2025 |
| Organic share of B2B traffic | ~76% | Resourcera, 2026 |
| Cost per lead, organic | $31 to $147 | Resourcera, 2026 |
| Cost per lead, paid search | ~$280 | Resourcera, 2026 |
| Close rate, organic vs outbound | 14.6% vs 1.7% | SeoProfy aggregate, 2025 |
How to read these without getting burned
⚠️ Dates and windows beat headline size
A 748% figure from a three-year window is not comparable to a 702% figure from a seven-month payback model. Before any of these enter a slide, write the publisher, the year, and the measurement window next to them.
I have watched this one habit save a budget conversation. When a CFO sees the window stated, the number stops looking like marketing arithmetic. Our GEO ROI and revenue attribution framework uses the same discipline on every client model.
🎯 Revenue contribution is the defensible number
Traffic share is interesting. Revenue share is arguable in a board room. The 44.6% revenue contribution figure is the one that survives follow-up questions, because it already accounts for the fact that most organic visitors never convert.
MaximusLabs AI measures engagements on pipeline rather than mentions, and that choice changes which numbers we even collect. For Oliv AI, the work produced a 64% AI citation rate in six months, against roughly 30% for billion dollar incumbents, and 27 qualified leads, $47K+ pipeline, 26% close rate in 4 months, as documented in the Oliv AI case study. Clicks and impressions are vanity metrics if they do not move the revenue needle.
✅ The three numbers to put on the slide
Take revenue contribution (44.6%), cost per lead versus paid (around $31 to $147 against $280), and close rate (14.6% versus 1.7%). Those three survive scrutiny together, because each one is a ratio rather than a volume.
I spent my WiseMonk years in a company where 98% of revenue came from SEO. That taught me organic ROI is real, but only when content sits where buyers decide, not where traffic is cheapest, which is the core premise of our revenue-focused B2B SEO service.
Q2. How much have AI Overviews actually compressed B2B organic CTR?
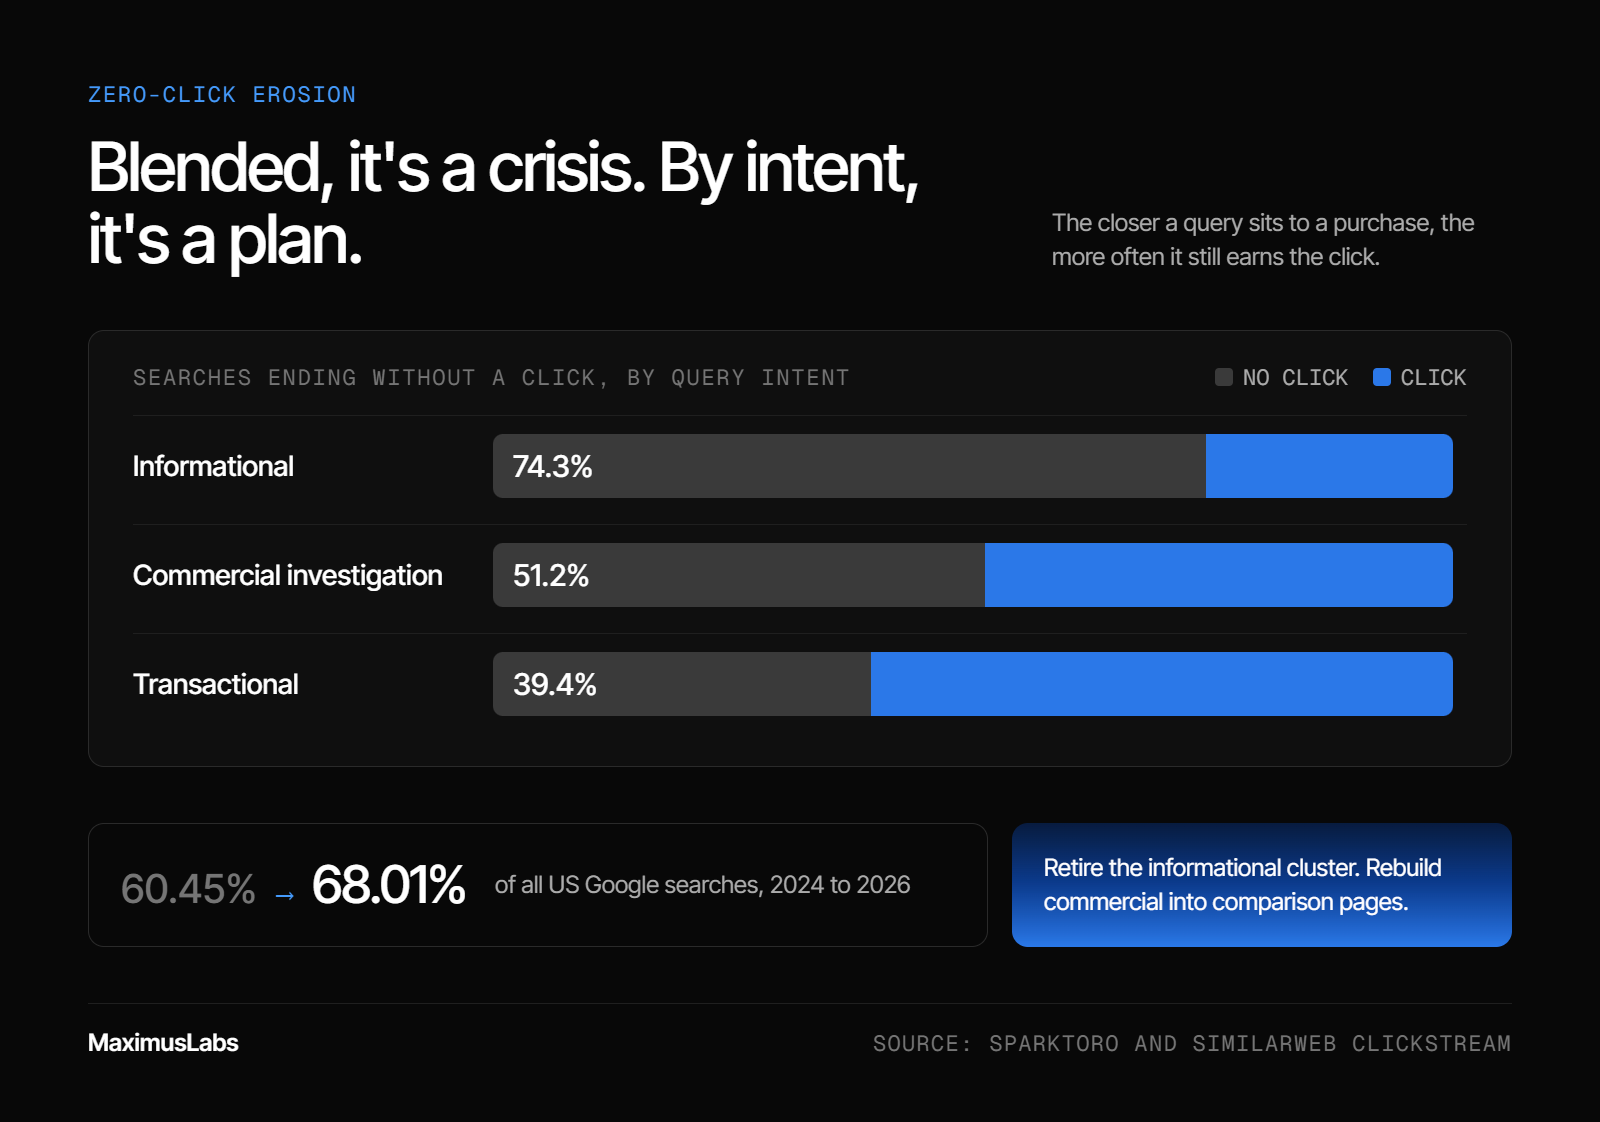
Position-one organic click-through rate falls about 34.5% when an AI Overview appears, and 68.01% of US Google searches now end without a click, up from 60.45% in 2024. The erosion is uneven. Informational queries sit near 74.3% zero-click, commercial investigation near 51.2%, and transactional near 39.4%. Published estimates range from 15% to 89% depending on method, so check the sample size before quoting any of them.
The situation: good pages, falling graphs
⏰ What the dashboard looks like now
The pattern repeats across B2B blogs. Rankings hold. Impressions hold or rise. Sessions fall. Nothing in the old reporting stack explains it, because the loss happens inside the result page, before the click.
Zero-click search means the searcher gets the answer on the results page and never visits a site. That is now the default outcome on informational queries, according to SparkToro and Similarweb clickstream analysis, and we track the pattern by cluster in our AI search click-through rate research.
"Organic traffic that used to come through SEO very predictably, including to folks like HubSpot, has gone down literally by about 20 to 40% based on which industry you are in."
— Sam Lessin, My First Million podcast
The complication: the numbers fight each other
📉 34.5%, and why the trigger rate matters more
Ahrefs studied 55.8 million queries in May 2025 and found AI Overviews on 12.8% of results, reducing position-one CTR by 34.5%. Other 2026 trackers put the trigger rate near 48%. Both can be accurate, because they sample different keyword sets.
That gap is the single most misquoted thing in this category. A 12.8% trigger rate across all queries and a 48% rate across tracked commercial keywords are not the same measurement.
⚠️ Blended averages hide the real risk
Pew Research found click-through at 8% with an AI Overview present, against 15% without. Averaged across a site, that reads like catastrophe. Segmented by intent, it reads like a reallocation instruction.
Krishna's honest position: I used to fear this number. Now I think the blended version causes worse decisions than the loss itself.
The resolution: move budget, not panic
🎯 Trigger rates by query type
| Query type | AI Overview trigger rate | Zero-click rate |
| "How to [task with software]" | 73% | ~74.3% (informational) |
| "Tool A vs Tool B" | 87% | ~51.2% (commercial) |
| Branded or purchase intent | Lower | ~39.4% (transactional) |
Comparison queries trigger overviews most often, yet they still produce clicks, because buyers want detail the summary cannot carry.
MaximusLabs AI treats this split as a content allocation rule rather than a headline. We run Answer Engine Optimization (AEO), the practice of making content the answer AI engines cite, with SEO underneath it, and we skip top-of-funnel definition content deliberately. AI engines already answer "what is X" without sending anyone anywhere.
✅ What to change on Monday
Pull your top 50 declining URLs. Tag each one informational, commercial, or transactional. Retire or consolidate the informational cluster, and rebuild the commercial cluster into comparison and evaluation pages. That is the whole move.
Q3. Is Google shrinking, or are AI platforms adding a second search surface?
Both surfaces are growing. Gartner forecast a 25% search-volume drop by 2026, but clickstream data shows Google volume grew about 21.6% in 2024, holding roughly 93.57% market share and around 14 billion searches per day, close to 373 times ChatGPT's estimated 37.5 million daily search queries. Adoption of AI search is still real: ChatGPT passed 900 million weekly users, Google's AI Mode passed one billion monthly users, and 51% of B2B buyers now start research in chatbots.
The verdict first
📊 Forecast versus measurement
| Claim | Source, year | What it says |
| Search volume drops 25% by 2026 | Gartner forecast, 2024 | Users substitute chatbots for search engines |
| Google volume grew ~21.6% in 2024 | SparkToro clickstream, Fishkin, 2025 | Measured panel data, not projection |
| Google holds ~93.57% share | SparkToro, 2025 | Share loss is marginal so far |
| 373x more searches than ChatGPT | SparkToro, 2025 | Scale gap remains enormous |
Forecasts model intent. Clickstream measures behavior. When they disagree, behavior wins.
⚠️ Retire the "Google is dying" line
The 25% decline claim is still quoted in 2026 strategy decks. It has been falsified by measured data, and using it costs you credibility with anyone who has read Fishkin's work. I say this as someone who believes the shift is real. Overstating it is how marketers lose the argument they should be winning. Our GEO versus traditional SEO comparison keeps both surfaces in the same frame for this reason.
What adoption actually looks like
🚀 Two surfaces, very different roles
ChatGPT's 900 million weekly users and AI Mode's billion monthly users are real demand. Yet Google still sends roughly 345 times more referral traffic than ChatGPT, Gemini, and Perplexity combined. One surface decides. The other delivers visits.
G2's April 2026 buyer research found 51% of B2B buyers now start research with AI chatbots more often than traditional search. That is where the consideration set gets built, well before any click happens, and it is the behavior mapped in our B2B SaaS buyer journey in AI search report.
💡 The expanding pie, not the shrinking one
My read is that AI chat is additive. People ask questions they never typed into a search box, which grows total discovery rather than splitting a fixed pool. Gartner's broader projection, that over half of search traffic moves to AI-native platforms by 2028, can still hold without Google shrinking today.
I might be reading the additive effect too strongly, and I will say so plainly. The data I trust is two years old at most, and panels have blind spots.
✅ Fund it as additive capture
Treat AI search as a second surface with its own budget line, not as a replacement for the first. Keep Google spend intact while you build citation presence. Anyone telling you to defund Google organic in 2026 is arguing against the measurement.
Q4. Does ranking #1 on Google still get you cited by AI engines?
Not reliably. After Gemini 3 became the default AI Overviews model on January 27, 2026, reliance on top-10 organic results for citations fell from roughly 76% to about 38%, and around 31% of citations now come from organic positions beyond 100. Separate analysis finds 80% of AI-cited URLs rank nowhere in Google's top 100. MaximusLabs AI tracks citation share per engine, separately from rank, because the two surfaces now move independently.
The situation: rank as a stand-in for visibility
📉 One number doing two jobs
Most reporting still uses rank as the proxy for AI visibility. It was a fair proxy in 2024, when AI Overviews drew heavily on the top 10. It is now a weak one.
Ask a simple question of your own dashboard: if you lost every AI citation next month, would any report you receive show it? For most teams the answer is no, which is exactly the gap our AI search visibility and brand mention tracking guide addresses.
The complication: an overnight reshuffle
⚠️ Before and after Gemini 3
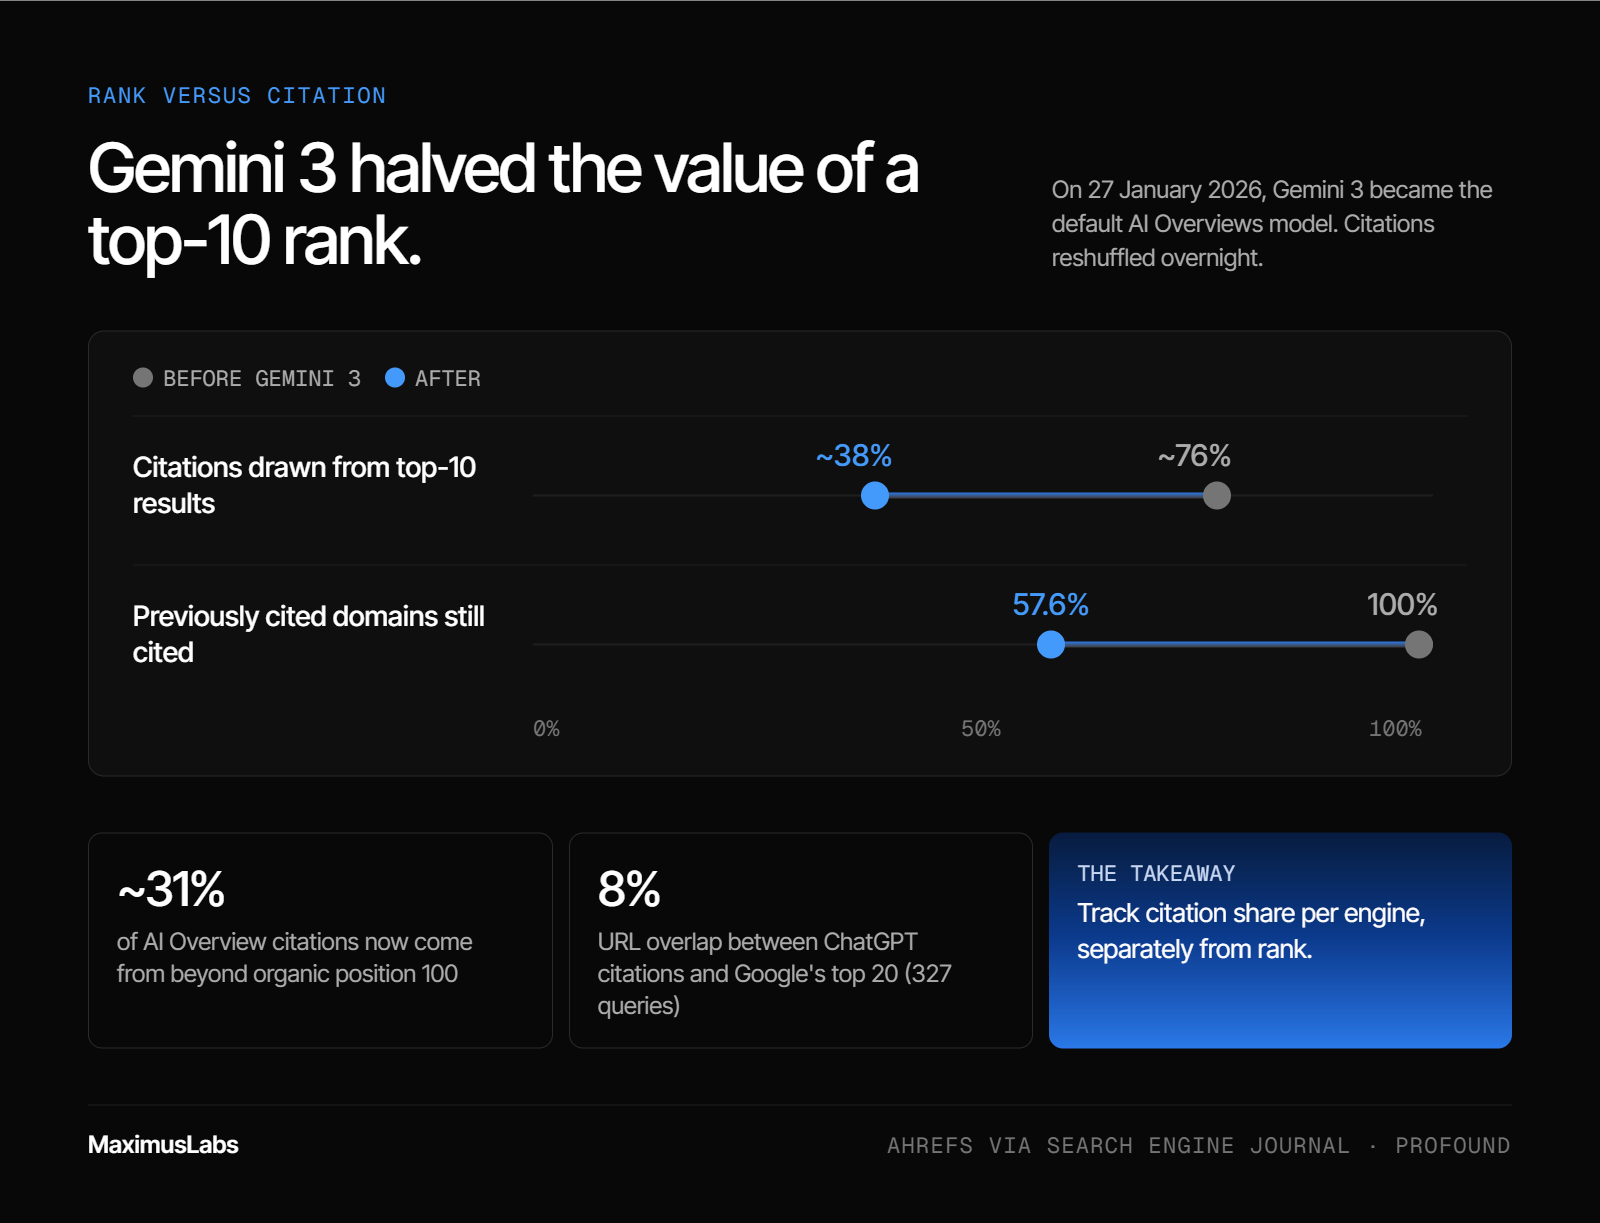
| Measure | July 2025 | February 2026 |
| Citations drawn from top-10 organic | ~76% | ~38% |
| Citations from positions beyond 100 | Minimal | ~31% |
| Domains impacted by the model change | - | 84,000+ |
| Cited domains dropped | - | 42.4% |
| Top 500 authoritative domains dropped | - | 1 |
That last row is the one I keep returning to. Established, trusted domains were almost untouched while 42.4% of cited domains fell away, per the Ahrefs analysis reported in Search Engine Journal. The moat widened for sites with real authority, and our Gemini 3 AI search impact breakdown tracks the fallout domain by domain.
The reconciliation: two conflicting studies, both right
💡 Why 80% and 76% can coexist
One dataset says 76% of AI Overview citations come from top-10 pages. Another says 80% of AI-cited URLs do not rank in the top 100. They measure different engines. AI Overviews lean on Google's own index, while ChatGPT and Perplexity retrieve differently.
Profound's analysis of 327 commercial queries found just 8% URL overlap between ChatGPT citations and Google's top 20, with a correlation of -0.98. Google ranked merchant pages. ChatGPT cited editorial aggregators.
🎯 Per-platform, not per-page
| Approach | What it measures | Blind spot |
| Traditional SEO retainer | Google rank, impressions | AI citations entirely |
| Generic "GEO add-on" | One blended AI visibility score | Which engine, and why |
| MaximusLabs AI | Daily citation share per engine, mapped to source trust | Still probabilistic, needs repeat runs |
MaximusLabs AI runs daily AI-visibility tracking across major engines and a citation-intelligence layer that maps which sources each engine trusts, then works to get clients into those sources through citation optimization for AI search. The Princeton GEO study supports the mechanism: adding statistics, quotations, and source citations lifted visibility up to 40%, with no benefit from keyword stuffing.
✅ Track both, starting this week
Keep rank tracking. Add citation tracking across ChatGPT, Perplexity, Gemini, and Google AI Overviews, and run each prompt variant several times, since answers are probabilistic. Only around 14% of marketers do this today, which is still an advantage available cheaply.
My founding observation at WiseMonk was simpler than any of these studies. Companies were showing up in ChatGPT while sitting nowhere in Google's top 10, two years before the data said so.
Q5. What does buying-committee data say about which content actually earns pipeline?
B2B purchases now involve 10 to 11 stakeholders across cycles averaging 11.5 months, with roughly 96% of buyers researching independently before contacting sales and 91% preferring to buy online. The decisive content is evaluation-stage: comparisons, pricing pages, product documentation, and third-party review profiles. Top-of-funnel definition content no longer earns the first conversation, because AI engines answer those questions without sending a click.
The committee is bigger than your content plan assumes
👥 Eleven people, eleven different questions
A single purchase decision now passes through 10 to 11 stakeholders. The security reviewer, the finance approver, and the end user each arrive with a different question. One blog post cannot serve all three.
Across an 11.5-month cycle, those people research at different times. That is why a content library built for one persona underperforms, even when traffic looks healthy, a pattern we document in our B2B SaaS buyer journey in AI search report.
⏰ The first contact happens late
Roughly 96% of B2B buyers research independently before they speak to sales. By the time a demo request lands, the shortlist already exists. Your content either shaped that shortlist or it did not.
Gartner's buying-committee research makes the same point from the seller's side: most of the cycle happens where no sales rep is present. The content is the rep.
Mapping assets to the stage that actually converts
📊 Funnel-stage mapping, with the zero-click reality attached
| Stage | Buyer question | Asset that answers it | Zero-click rate |
| Top of funnel | "What is category X?" | Definition post | ~74.3% (informational) |
| Mid funnel | "Which tools fit my team?" | Comparison, alternatives, listicle | ~51.2% (commercial) |
| Bottom of funnel | "Does it do X, and what does it cost?" | Pricing, docs, integration pages | ~39.4% (transactional) |
Read the right-hand column as a click-survival forecast, drawn from zero-click clickstream analysis. Definition content loses the click roughly three times out of four. Evaluation content still earns the visit, because a summary cannot carry the detail a committee needs.
⚠️ The shortlist forms before anyone reaches your site
Here is the part that changed my own planning. When a buyer asks ChatGPT for the best tools in a category, five to ten names come back. That list is the consideration set.
If your brand is absent, no amount of evaluation content helps, because nobody arrives to read it. The sample set problem comes before the conversion problem, which is why our B2B SaaS AEO strategy work starts with shortlist presence rather than page count.
✅ Audit by committee role, not by keyword
Run this on Monday. List your top 30 organic assets. Next to each one, write which committee role it serves and which stage it answers. Most teams find the same imbalance: heavy top-of-funnel coverage, thin documentation, and no answer for the finance or security reviewer.
Then check what AI engines say about your category. Ask the same question five ways and record which vendors appear. That tells you whether you are in the shortlist at all, and our question research method for AI search turns that check into a repeatable process.
MaximusLabs AI measures every engagement on pipeline, not on mentions, and that forces the content plan to start at the evaluation stage. Being named by an AI engine is the means. The qualified conversation is the outcome clients hire us for.
Q6. Which content formats and on-page placements do AI engines cite most?
Technical documentation is cited most. Median citation rates run 34% to 41% for technical docs against 15% to 18% for blog and editorial content, and on Perplexity the gap widens to 46% to 70% versus 3% to 6%. Placement compounds the effect, with answer blocks in the top 30% of body text capturing about 44.2% of citation share. MaximusLabs AI requires a standalone 40 to 80 word answer block at the top of every section for this reason.
The format hierarchy, ranked by measured citation rate
📊 Docs beat blogs by 10x to 15x
| Format | Median citation rate | Share of all citations |
| Technical documentation, API references, help guides | 34% to 41% | 29% |
| Blog and editorial content | 15% to 18% | Lower per page |
| Technical docs on Perplexity specifically | 46% to 70% | Highest |
| Blogs on Perplexity specifically | 3% to 6% | Lowest |
Documentation wins for mechanical reasons, not stylistic ones. It is structured, self-contained, and answer-dense. Each page solves one question completely, which is exactly what a retrieval system wants, as our citation pattern research across ChatGPT, Perplexity, and Gemini shows format by format.
💡 Why retrieval rewards structure
AI answers work through retrieval-augmented generation (RAG), meaning the engine searches, pulls passages, then writes an answer from them. Optimization happens at the retrieval step, not the writing step.
A narrative essay buries its answer in paragraph seven. A doc page states it in line one. Only one of those survives passage-level extraction, a constraint our AEO answer structure guidelines build around.
Placement decides who gets extracted
🎯 The ski-ramp distribution
About 44.2% of citations come from the top 30% of page text. Citation probability drops sharply as you move down the page. Practitioners call it a ski-ramp curve.
The fix is a front-loaded answer block of 30 to 60 words, placed immediately under each heading. No preamble, no scene-setting, just the answer. Our content formatting standards for AI search enforce the same placement rule page-wide.
⭐ The peer-reviewed levers
The Princeton and IIT Delhi GEO study tested nine optimization methods across 10,000 queries. Adding statistics, quotations, and inline source citations lifted visibility up to 40%, and pages ranked around position five gained roughly 115% relative visibility from source citations alone.
Keyword stuffing produced no gain. That single result should end a lot of 2019-era content briefs.
✅ What to ship this quarter
Publish or rebuild product documentation as public, crawlable HTML pages.
Add a 30 to 60 word answer block under every heading on your top 20 pages.
Insert at least one named statistic and one attributed quotation per section.
Cite primary sources inline, with publisher and year visible to the reader.
Keep paragraphs to two to four sentences so passages extract cleanly.
MaximusLabs AI treats a standalone answer block per section as non-negotiable, along with Flesch 55 or higher and short paragraphs. Those are citation-eligibility thresholds in our workflow, not style preferences. We run Answer Engine Optimization with SEO underneath it, and this is where the two meet.
Q7. What does Google officially say works, and what does it say is useless?
Google states that AI Overviews and AI Mode draw on the same Search index as regular results, with no additional requirements, no AI-specific schema, and no use of llms.txt. AI-feature clicks appear in the Search Console Generative AI performance report. Keyword stuffing performs roughly 10% below baseline on Perplexity, and Google retired FAQ rich results on May 7, 2026.
What the documentation actually says
📘 Same index, same eligibility
Google's guidance on AI features is blunter than most vendor content admits. AI Overviews and AI Mode use the same index and the same eligibility rules as standard Search results. If a page can rank, it can be cited.
Google's generative AI optimization guide adds that there are no extra technical requirements beyond normal Search best practice. Crawlability, indexability, and useful content remain the whole checklist, which is exactly what our technical GEO implementation work covers first.
✅ The official measurement surface
The Search Console Generative AI performance report is where Google reports clicks and impressions from AI features. That is your baseline, free, and first-party.
Most teams I meet have not opened it. Start there before buying anything else, then layer on the methods in our AEO measurement and metrics guide.
The ruled-out and the contested
❌ Tactics Google says do nothing
| Tactic | Status | Source |
| llms.txt file | Not used by Google Search | Google Search Central |
| AI-specific schema types | Do not exist, not required | Google Search Central |
| Keyword stuffing for AI visibility | About 10% below baseline on Perplexity | KDD GEO study, 2024 |
| FAQ rich results | Retired May 7, 2026 | Google Search Central |
Vendors are still selling llms.txt implementations in 2026. Google's own documentation says the file is unused. That is not a judgment call, it is a stated fact, and our llms.txt explainer sets out where the file does and does not help.
⚠️ Where the evidence genuinely splits
Schema markup is the honest open question. A controlled analysis across OpenAI, Gemini, and Perplexity found no direct correlation between JSON-LD schema density and AI citation rates. SALT.agency frames schema differently, as parsing hygiene and entity disambiguation rather than a ranking lever.
My read is that both findings can stand. Schema helps machines identify what your entity is, which matters for being understood, not for being preferred. I hold that loosely, and I will change it if better data lands. Our schema markup primer treats it as hygiene for the same reason.
⏰ A one-week audit
Day one, open the Generative AI performance report and record a baseline. Day two, confirm GPTBot, OAI-SearchBot, and PerplexityBot are not blocked in robots.txt. Day three, check that critical content renders in HTML rather than JavaScript.
Day four, remove any FAQ schema you added purely for rich results. Day five, verify your Organization schema links out to Wikidata, LinkedIn, Crunchbase, and G2. Best-practice SEO has become the baseline for AEO, not the finish line, and our AI crawler management guide covers the robots.txt step in detail.
MaximusLabs AI starts client engagements with this audit before any content ships, because broken crawlability makes every later decision unmeasurable. The work is unglamorous. It is also the cheapest fix available.
Q8. What moves AI visibility more, backlinks or off-site brand mentions?
Brand mentions. Across a 75,000-brand study, web mentions (linked and unlinked) correlate with AI Overview visibility at Spearman r=0.664, roughly three times stronger than backlinks at r=0.218. Only about 11% of cited domains overlap between ChatGPT and Perplexity, and 71% appear on a single platform. MaximusLabs AI builds off-site presence surface by surface for this reason, and calls the practice Search Everywhere Optimization.
The situation: links as the default line item
💰 Where the budget still goes
Most B2B SEO budgets still allocate a fixed monthly spend to link acquisition. It is the easiest line item to justify, because the output is countable. Twenty links bought, twenty links reported.
That logic came from an era when links were the dominant trust signal Google could measure at scale. It is not wrong. It is just no longer the strongest lever for AI citation, as our AI citation acquisition tactics set out.
The complication: the correlations disagree with the budget
📊 r=0.664 versus r=0.218
Ahrefs studied 75,000 brands and found web mentions correlating with AI Overview visibility at r=0.664, against r=0.218 for backlinks. Spearman correlation simply measures how reliably two things move together, on a scale up to 1.
Unlinked mentions counted. A podcast naming your product, a Reddit comment recommending it, a listicle including it: all of it registered.
⚠️ Each engine reads a different web
Only about 11% of cited domains overlap between ChatGPT and Perplexity for the same question, and 71% of cited domains appear on just one platform. One off-site win does not transfer across engines.
That is the part I misjudged early. I assumed authority was portable between AI platforms. The data says each engine keeps its own trusted-source list, which is why our citation consistency framework treats each engine as its own target.
The resolution: build presence where each engine looks
🎯 Reallocating the off-site budget
| Surface | What it produces | Engine effect |
| G2, Capterra, review profiles | Structured third-party validation | Heavy weight in software answers |
| Reddit and community threads | Unlinked practitioner mentions | Strong on ChatGPT |
| Category listicles and roundups | Editorial aggregation | Strong on Perplexity |
| Podcasts and guest appearances | Brand mentions, no link needed | Broad, slow compounding |
MaximusLabs AI runs two pillars together: Owned AEO, where your own content becomes the answer, and Earned AEO, where reviews, Reddit, press, and listicles make engines trust you. Most agencies only do the first, because the second cannot be shipped from a CMS. For Nidra Goods, owned content plus off-site presence produced number-one positions across Google, ChatGPT, and Perplexity simultaneously for "best sleep mask", as recorded in the Nidra Goods case study.
✅ The Monday reallocation
Move a third of your link budget to review-profile work and community presence for one quarter. Track citation share per engine before and after, running each prompt several times. Our Reddit and forum AEO playbook covers the community half of that shift.
My position is that brand beats algorithm here. Build a brand people mention without being asked, and AI engines have little choice but to name you. Krishna's version of that line is shorter: stop optimizing for Google, start optimizing for trust.
Q9. Why do G2 and Capterra decide which B2B tools AI recommends?
Because they own the citation supply. After G2 acquired Capterra, Software Advice, and GetApp from Gartner for roughly $110M, closing February 5, 2026, the G2 family controls about 84% of review-site citations in bottom-of-funnel B2B queries. Of the tools ChatGPT names in software answers, 100% had Capterra reviews and 99% had a G2 profile. MaximusLabs AI builds closed sameAs entity loops across these surfaces as standard setup work for client engagements.
One family now supplies most of the proof
💰 The acquisition that concentrated the market
The Gartner-to-G2 transaction closed on February 5, 2026. Four of the largest software review properties now sit under one roof. For AI answers about software, that means most third-party validation flows through a single corporate pipe.
Roughly 84% of review-site citations in evaluation-stage B2B queries now come from that family. Concentration like this rarely gets discussed in SEO reporting, because review profiles are not treated as content assets, a blind spot our 2026 GEO and AEO benchmark report measures directly.
⚠️ The review gate is close to absolute
Across tools ChatGPT names in software recommendations, 100% had Capterra reviews and 99% had a G2 profile. Read that as a precondition rather than a correlation.
A missing review profile is not thin coverage. It is exclusion from the evaluation set, before any content you publish gets considered. Our B2B SaaS AEO and GEO work treats profile completeness as a gating task, not a nice-to-have.
Making your entity legible to engines
🔗 The closed sameAs loop
Schema.org provides a property called sameAs, which lets you declare that your site and an external profile describe the same entity. Used properly, it forms a loop.
MaximusLabs AI implements that loop as standard setup: sitewide Organization schema linked via sameAs to Wikidata, Crunchbase, LinkedIn, and G2, then back to the site. Wikidata even carries a dedicated G2 Product ID property, P12136, which makes the connection machine-readable. We do this before publishing content, because an engine that cannot resolve your entity cannot trust it, and our entity optimization and knowledge graph guide walks through the full loop.
⭐ Why this matters more for challengers
For UnderDefense, competing against multi-deca-billion-dollar cybersecurity incumbents, third-party trust surfaces carry as much weight as owned content. Budget cannot buy a review profile that does not exist. That dynamic drives our cybersecurity AEO work.
My read is that this is the cheapest leverage available in B2B AEO right now. I have not seen a case where fixing it hurt, which makes me slightly suspicious of my own confidence here.
✅ The Monday checklist
Claim and complete profiles on G2 and Capterra, including categories and feature tags.
Collect at least ten recent reviews per platform, since recency affects display.
Add Organization schema with sameAs links to G2, LinkedIn, Crunchbase, and Wikidata.
Create or correct your Wikidata item, and add the G2 Product ID (P12136).
Ask ChatGPT and Perplexity for the best tools in your category, then record which review sites they cite.
That last step takes ten minutes and tells you whether the gate is open or closed for your brand. MaximusLabs AI runs Earned Answer Engine Optimization alongside owned content for this reason, because reviews, press, and community mentions are what make engines trust a name they are about to recommend.
Q10. Does AI search traffic convert better than Google organic?
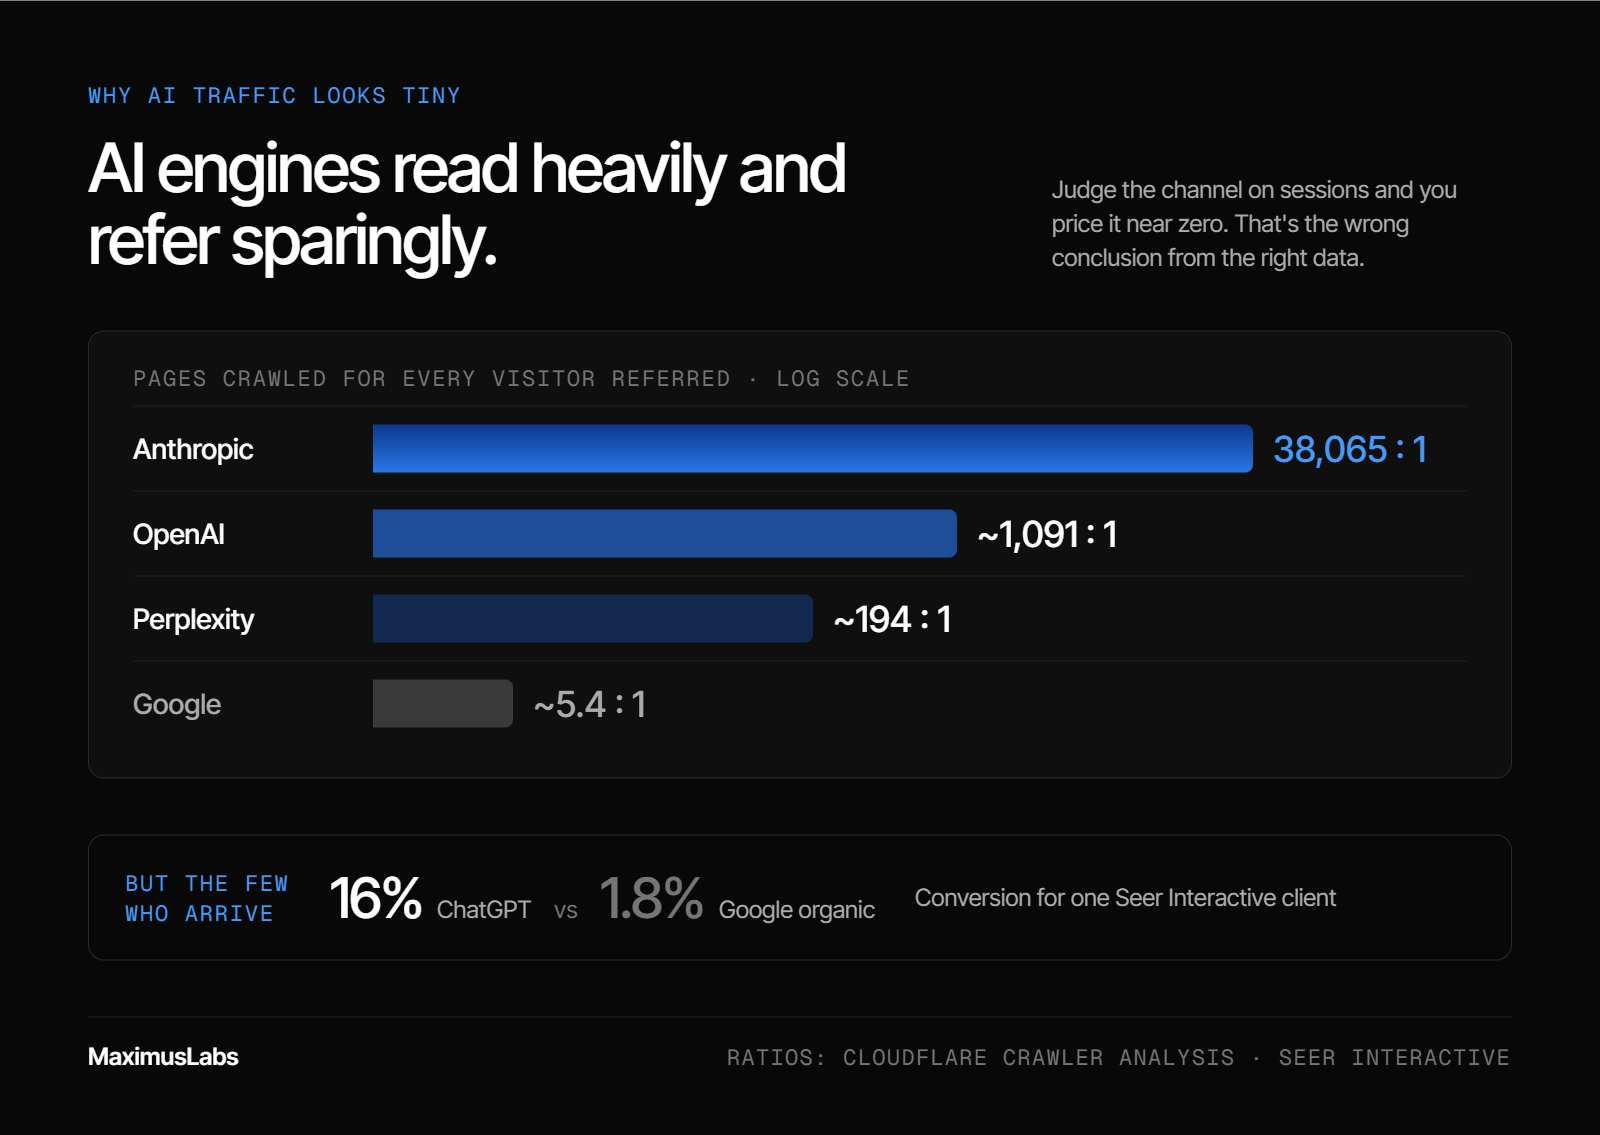
Yes, substantially. Webflow measured LLM-referred visitors converting at six times the rate of traditional Google organic traffic, while those referrals contributed about 8% of signups. One Seer Interactive client recorded 16% conversion from ChatGPT traffic against 1.8% from Google organic. Volume stays small because AI crawlers read far more than they refer. MaximusLabs AI reports AI visibility against pipeline rather than sessions for this reason.
The situation: a channel that looks like a rounding error
📉 What GA4 shows you
Open your acquisition report and AI referrals look trivial. A few hundred sessions from ChatGPT, fewer from Perplexity, often lumped into Direct traffic. Nothing in that view suggests a priority.
Google Analytics 4 attributes a visit to the referrer it can see. When an AI engine strips or omits the referrer, the session lands in Direct, and the channel disappears from your reporting, which is the measurement gap our GEO measurement and metrics guide exists to close.
The complication: the quality is inverted
💰 Six times, on 8% of signups
Webflow's own measurement, shared publicly by Ethan Smith of Graphite, found a six times conversion gap between LLM traffic and Google search traffic, with LLMs driving roughly 8% of total signups. A Seer Interactive client saw 16% versus 1.8%.
Those visitors arrive after the evaluation, not before it. The engine already compared options and named yours, so the buyer lands pre-sold.
"Web Flow we saw a 6x conversion rate difference between LLM traffic and Google search traffic."
— Ethan Smith, CEO of Graphite
⚠️ Why the volume stays low
Crawl-to-refer ratios explain the illusion. Anthropic crawls roughly 38,065 pages for every visitor it refers. OpenAI sits near 1,091 to 1, Perplexity near 194 to 1, and Google near 5.4 to 1, per Cloudflare's crawler analysis.
The engines read heavily and send sparingly. Judging the channel on sessions therefore prices it almost at zero, which is the wrong conclusion from the right data. Our AI crawler optimization guide covers how to read those logs properly.
The resolution: measure the conversation, not the click
🎯 A worked funnel
Take 400 AI-referred sessions against 20,000 Google organic sessions. At 1.8% versus 16%, the Google cohort produces 360 conversions and the AI cohort produces 64.
Now check deal quality. If the AI cohort closes faster because the buyer arrived with a recommendation, that 64 can out-earn a large share of the 360. That is the calculation session reporting never shows you.
✅ Recover the dark referrals
Add a post-conversion question: "How did you hear about us?" Keep it free text, and read it monthly. In practice, this is the only reliable way to catch buyers who asked ChatGPT, then typed your domain directly.
MaximusLabs AI treats this as the core of Revenue-focused Answer Engine Optimization. Clicks and impressions are vanity metrics if they do not move the revenue needle, so we tie citation share to pipeline, including self-reported attribution at conversion, using the model set out in our revenue-focused R-GEO framework. For Oliv AI, 30% to 40% of inbound is now AI-sourced.
When ChatGPT names you, it stakes its own credibility on the recommendation. That borrowed trust is why the conversion gap exists at all.
Q11. Why do 5% of your pages drive 85% of organic traffic?
Because organic performance follows a power law, not an average. Across content programmes at Webflow, Upwork, GlossGenius, Notion, and Rippling, 19 of 20 landing pages drove little or no traffic, while 1 in 20 generated roughly 85% of it. Publishing more pages raises the waste rate rather than the base rate. MaximusLabs AI plans content around finding and rebuilding that 5% instead of increasing volume.
The 5% Rule, stated plainly
📊 Nineteen pages that do nothing
Ethan Smith of Graphite has reported this pattern across named programmes including Webflow, Upwork, GlossGenius, Notion, and Rippling: one in twenty landing pages drives around 85% of traffic. The rest sit idle.
I used to assume that was a quality problem inside the 95%. It is closer to a distribution problem. Search demand itself is concentrated, so even competent pages can land in the dead band, which is why our GEO content refresh process starts with an inventory rather than a brief.
⚠️ Volume makes the ratio worse
Doubling output does not double winners. It usually doubles the dead band, while raising review load, internal linking complexity, and cannibalisation risk.
That is the quiet cost of a content retainer priced per article. The incentive rewards publishing, not rebuilding.
Unvetted AI output amplifies the problem
❌ The 99.3% example
Eric Enge documented a financial site built mostly on AI-generated content that lost 99.3% of its rankings after Google's November 2023 core update, which strengthened E-E-A-T evaluation (experience, expertise, authoritativeness, and trustworthiness).
That is not an argument against using AI. It is an argument against shipping AI drafts without human judgment layered on top, and our E-E-A-T optimization guide sets out what that judgment has to cover.
💡 The edit gradient
Practitioner testing points the same way: AI drafts rank better the more a human edits them. The editing is where the differentiation enters.
MaximusLabs AI built the Founder's Voice methodology around that finding. We sit with the leadership team, capture the founder's actual market perspective, and write from it, because the 95% waste band is filled with content any competitor could have published. The full process sits in our Founder's Voice methodology guide.
What to do with the ratio
✅ Audit, consolidate, rebuild
| Approach | What it optimizes | Known limitation |
| In-house team | Deep product knowledge | Highest cost per piece, slow to scale |
| Traditional agency retainer | Publishing volume | Rewards output, not rebuilding |
| Freelancers | Lowest unit cost | Thin on strategy and GEO depth |
| MaximusLabs AI | 15 to 50 pieces monthly, AEO-led, humans approve everything | Results compound over months, not weeks |
Run the audit this way. Pull every URL with organic entries. Sort by conversions, not sessions. Identify your top 5% and ask what they share, then rebuild the next tier to match that pattern. Consolidate or retire anything with no entries in six months.
I cannot tell you in advance which page becomes the winner. Nobody can. What MaximusLabs data supports is that depth on fewer assets beats breadth across many, and that pipeline attribution makes the winners visible faster.
Q12. What should you measure instead of rank, and do you need a $1,000 per month AEO tool?
Measure Share of Answers. Run each question variant seven to ten times across platforms and record how often your brand appears, because large language model output is probabilistic rather than fixed. Most teams do not need a thousand-dollar monthly tracker. Over 60 AEO tools perform near-identical API-based tracking, roughly 95% query vendor endpoints rather than live logged-in sessions, and in-house scripts have been built for cents per question. MaximusLabs AI runs its own tooling and reports Share of Voice across question variants and engines.
The situation: rank data, in an answer-based world
📊 A dashboard that cannot see the problem
Most teams still open a rank tracker on Monday morning. It shows positions, impressions, and movement. It shows nothing about whether an engine named you when a buyer asked for recommendations.
Rank answers "where does my page sit." Buyers now ask "which tools should I consider." Those are different questions, and only one of them decides the shortlist, a distinction our AEO tools comparison uses to separate trackers from decision systems.
The complication: the tools mostly do one thing
⚠️ Sixty tools, one feature
Ethan Smith's team catalogued more than 60 AEO tracking tools and found them functionally similar: ask a question, record whether the brand appeared, chart it over time. His own team built the same capability internally for a few cents per question.
"We have a page with 60+ AEO tools and they all do the same thing: They all do tracking. Pick the tool that does what you want and has the lowest cost. And two years from now, you'll probably be using Ahrefs anyway."
— Ethan Smith, CEO of Graphite
❌ API answers are not user answers
Roughly 95% of third-party AEO platforms query vendor API endpoints rather than scraping live, logged-in browser sessions. API responses can return a different citation mix than a real user sees, because personalization, memory, and live retrieval differ.
Knowing what you rank does not cause an outcome. Neither does knowing you were mentioned, unless the measurement connects to pipeline. Our ChatGPT tracking tool evaluation applies that test to each vendor.
The resolution: a stack you can stand up this week
🎯 Build versus buy
| Option | What it gives you | Honest limitation |
| Free manual testing | Ground truth from live UI sessions | Labour intensive, hard to repeat weekly |
| Commodity AEO tracker | Automated charts, fast setup | API-based, feature set likely bundled by incumbents later |
| In-house script | Cents per question, full control | Needs engineering time and maintenance |
| MaximusLabs AI | Daily tracking per engine, citation intelligence, pipeline reporting | Interpretation-led, so it is a service and not a self-serve dashboard |
Start with Search Console's performance reporting as your free baseline. Then build a prompt set of 30 to 50 buyer questions, run each seven to ten times across ChatGPT, Perplexity, Gemini, and Google AI Overviews, and log appearance frequency plus which sources the engine cited. Our GEO metrics and KPI framework defines what to log at each step.
✅ What to report upward
Report three things: Share of Answers by question cluster, which third-party sources the engines trust in your category, and pipeline sourced or influenced by AI referrals. Drop mention counts that connect to nothing.
MaximusLabs AI built internal tooling because tracking is a commodity and interpretation is not. Share of Voice across thousands of question variants tells you whether you sit in the consideration set, and a rank number does not. For Oliv AI, the work produced 27 qualified leads, $47K+ pipeline, 26% close rate in 4 months, as detailed in the Oliv AI case study.
There is no single rank in AI. There is only how often you show up, and what that presence is worth at the end of the quarter.
Frequently asked questions
What is the average ROI of B2B SEO in 2026?
Published figures cluster between 702% and 748% ROI, with break-even usually landing around month seven and peak returns in year two or three. The spread is not a disagreement. It reflects different measurement windows, cohort sizes, and attribution models. • 748% comes from multi-year models that reward compounding. • 702% with a seven-month payback comes from tighter B2B SaaS cohorts. • 22:1 return ratios appear where revenue, not leads, is the denominator. Three ratios survive scrutiny in a board meeting better than any headline percentage: organic contributing about 44.6% of B2B revenue, cost per lead of $31 to $147 against roughly $280 for paid search, and a 14.6% close rate versus 1.7% for outbound. MaximusLabs AI measures every engagement on pipeline rather than impressions, which changes which numbers get collected in the first place. For Oliv AI, that produced 27 qualified leads, $47K+ pipeline, and a 26% close rate in four months. Before any figure enters your slide, write the publisher, year, and measurement window beside it, and model the forecast using our GEO ROI and revenue attribution approach.
How much have AI Overviews reduced organic click-through rate?
Estimates range from 15% to 89% depending on method, so the sample size matters more than the headline. The most defensible figure is a 34.5% drop in position-one CTR when an AI Overview appears, measured across 55.8 million queries where overviews showed on 12.8% of results. • Pew Research recorded 8% click-through with an overview present versus 15% without. • Zero-click searches hit 68.01% of US Google searches in 2026, up from 60.45% in 2024. • Trigger rates differ wildly by keyword set, which is why some trackers report 12.8% and others 48%. The blended average causes worse decisions than the loss itself. Segmented by intent, informational queries sit near 74.3% zero-click while transactional queries stay near 39.4%. Comparison queries trigger overviews on about 87% of searches yet still produce clicks, because a summary cannot carry evaluation detail. MaximusLabs AI treats that split as a content allocation rule, moving budget from definition content into comparison and evaluation pages. Our AI search click-through rate research tracks the erosion cluster by cluster rather than site-wide.
Is Google search volume actually shrinking because of ChatGPT?
No. A widely quoted 2024 analyst forecast predicted a 25% search volume drop by 2026, and measured clickstream data falsified it. Google volume grew roughly 21.6% in 2024, holding about 93.57% market share and around 14 billion searches per day, close to 373 times ChatGPT's estimated 37.5 million daily search queries. • Forecasts model intent. Clickstream measures behavior. When they disagree, behavior wins. • Google still sends roughly 345 times more referral traffic than ChatGPT, Gemini, and Perplexity combined. AI adoption is still real and large. ChatGPT passed 900 million weekly users, Google's AI Mode passed one billion monthly users, and 51% of B2B buyers now start research with AI chatbots more often than traditional search. Those surfaces decide the shortlist. Google still delivers the visit. Our read is that AI chat is additive rather than substitutive, because people ask questions they never typed into a search box. Fund AI search as a second surface with its own budget line, not as a Google replacement. Our GEO versus traditional SEO comparison keeps both channels in one frame.
Does ranking number one on Google still get you cited by AI engines?
Not reliably. After Gemini 3 became the default AI Overviews model on January 27, 2026, reliance on top-10 organic results for citations fell from roughly 76% to about 38%, and around 31% of citations now come from organic positions beyond 100. A separate analysis found 80% of AI-cited URLs rank nowhere in Google's top 100. • 84,000+ domains were affected by the model change. • 42.4% of previously cited domains were dropped. • Only one of the top 500 authoritative domains fell away, so the moat widened for trusted sites. Two conflicting studies can both be right, because they measure different engines. AI Overviews lean on Google's index, while ChatGPT and Perplexity retrieve differently. One analysis of 327 commercial queries found just 8% URL overlap between ChatGPT citations and Google's top 20, with a correlation of -0.98. MaximusLabs AI tracks citation share per engine daily, separately from rank, because the two surfaces now move independently. Keep rank tracking, then add citation tracking using the method in our citation optimization guide for AI search.
Which content formats do AI engines cite most often?
Technical documentation wins by a wide margin. Median citation rates run 34% to 41% for technical docs against 15% to 18% for blog and editorial content, and on Perplexity the gap widens to 46% to 70% versus 3% to 6%. • Docs are structured, self-contained, and answer-dense, which suits passage-level retrieval. • Answer blocks placed in the top 30% of body text capture about 44.2% of citation share. • The peer-reviewed GEO study found statistics, quotations, and inline citations lifted visibility up to 40%, with no benefit from keyword stuffing. Placement matters as much as format. A narrative essay buries its answer in paragraph seven, while a documentation page states it in line one. Only one of those survives extraction, because optimization happens at the retrieval step rather than the writing step. MaximusLabs AI requires a standalone 40 to 80 word answer block at the top of every section, along with a Flesch score of 55 or higher and two to four sentence paragraphs. Those are citation-eligibility thresholds in our workflow, not stylistic preferences. Our AEO answer structure standards set out the exact pattern.
Why do G2 and Capterra decide which B2B tools AI recommends?
Because they now control the citation supply. After G2 acquired Capterra, Software Advice, and GetApp from Gartner for roughly $110M, closing February 5, 2026, the G2 family accounts for about 84% of review-site citations in bottom-of-funnel B2B queries. • Of the tools ChatGPT names in software answers, 100% had Capterra reviews. • 99% had a G2 profile, which reads as a precondition rather than a correlation. • A missing review profile is exclusion from the evaluation set, not thin coverage. The fix is unglamorous and cheap. Claim and complete both profiles with correct categories, collect at least ten recent reviews per platform, then make your entity machine-readable by closing the schema loop. MaximusLabs AI implements that loop as standard setup: sitewide Organization schema linked via sameAs to Wikidata, Crunchbase, LinkedIn, and G2, then back to the site, including the dedicated Wikidata G2 Product ID property. We do this before publishing content, because an engine that cannot resolve your entity cannot trust it. Our entity optimization and knowledge graph guide covers the full implementation.
What should B2B teams measure instead of keyword rank, and is a paid AEO tool worth it?
Measure Share of Answers: run each buyer question seven to ten times across engines and record how often your brand appears, because large language model output is probabilistic rather than fixed. A single run tells you almost nothing. • Over 60 AEO tracking tools perform near-identical work: ask a question, log the appearance, chart it. • Roughly 95% query vendor API endpoints rather than live logged-in sessions, so the citation mix can differ from what real users see. • In-house scripts have been built for cents per question, and incumbents will likely bundle this feature. Start with the free Search Console performance reporting as a baseline. Then build a prompt set of 30 to 50 buyer questions, run it across ChatGPT, Perplexity, Gemini, and Google AI Overviews, and log which sources each engine cited alongside your appearance rate. MaximusLabs AI built its own tooling because tracking is a commodity and interpretation is not, and we report Share of Voice plus pipeline rather than mention counts. Knowing what you rank does not cause an outcome. Our AEO measurement and metrics framework defines what to report upward.