 Krishna Kaanth M
- Median private B2B SaaS growth fell to 22% from 25%, so growth now depends on sequencing five engines rather than funding eleven strategies at once.
- Net new ARR equals new plus expansion minus churned. Fix activation and retention before funding more acquisition, because churn quietly replaces every new logo.
- Pure PLG stalls on enterprise buyers who need compliance review and a named human. The 2026 pattern is hybrid, with product-qualified-lead routing into sales.
- Pricing is the highest-leverage lever. A 1% pricing improvement moves revenue roughly 12% to 13%, around four times an equivalent acquisition gain.
- Clicks drop from 15% to 8% when an AI summary appears, and in-summary links are clicked in 1% of visits, so citations now matter more than rankings.
- Early churn is a positioning failure, not a roadmap gap. Median NRR sits at 103%, with the 90th percentile at 117.9%.
Q1. What are SaaS growth strategies that actually work in 2026?
SaaS growth strategies are funded, stage-specific bets on how a company acquires, activates, retains, and expands recurring revenue. Five engines matter in 2026: ICP and positioning, pricing and packaging, a hybrid product-led plus sales-assisted motion, a retention and expansion engine, and multi-surface AI answer visibility. Median private B2B SaaS growth fell to 22% from 25%, so sequencing beats breadth.
🎯 Strategy versus tactic, and why the distinction costs money
A strategy is something you fund for quarters and judge on revenue. A tactic is something you test in an afternoon and judge on a number. Most "SaaS growth strategies" articles mix the two, which is how a pricing overhaul and a LinkedIn posting cadence end up on the same list with equal weight.
The test I use is simple. If it cannot survive a quarter of ambiguity without being cancelled, it is a tactic. Treat it as one, and stop giving it a headcount.
📉 Why longer lists are getting more expensive
SaaS Capital's 15th annual survey of more than 1,000 private B2B SaaS companies puts median growth at 22%, down from 25% in 2024. Bootstrapped companies between $3M and $20M ARR sit at 15% median growth. Compression like that punishes breadth.
Eleven funded bets across a team of six means nothing gets a fair trial. The 5% rule applies here as much as it does to content: a small share of initiatives produces nearly all the business impact, and the rest consumes the calendar.
🧭 The five engines, and what each one actually owns
| Engine | What it controls | Primary metric |
| ICP and positioning | Who you sell to and how they understand you | Win rate, early churn |
| Pricing and packaging | Revenue per account and expansion path | ARPA, expansion ARR |
| Hybrid PLG plus sales | How deals get sourced and closed | Activation rate, PQL conversion |
| Retention and expansion | Whether revenue compounds or leaks | NRR, GRR |
| AI answer visibility | Whether buyers find you at all | Shortlist appearance, assisted pipeline |
Two of these create demand. Three of them capture or protect it. Outbound, PR, and advertising create demand that did not exist. Search, answer engines, and reviews harvest intent that already does. Mixing those jobs up is why so many channel reviews end in a stalemate.
⏰ How to read the rest of this playbook
Read it as a sequencing decision, not a menu. Each section after this answers one question: at your stage, with your churn and your pricing, does this engine get funded now or next year?
I will flag where the evidence is thin. Pricing elasticity and NRR benchmarks are well documented. AI answer visibility is newer, and anyone claiming precision there is overselling. My own read is that the direction is clear even where the magnitudes are not.
Q2. Which strategies get funded at your ARR stage, and what does the ARR math say?
Sequence by stage, not by popularity. Under $2M ARR: founder-led sales plus concentrated ICP content. $2M to $20M: product-led funnel feeding outbound, with activation instrumented. $20M+: hybrid PLG plus enterprise sales and CS-led expansion. At every stage, net new ARR equals new plus expansion minus churned, so fix activation and retention before funding more acquisition.
🧮 Start with the equation, not the channel list
Net new ARR has three terms. New business, expansion, and churn. Two of those three live after the sale. Growth plans that only address the first term are optimizing a third of the equation.
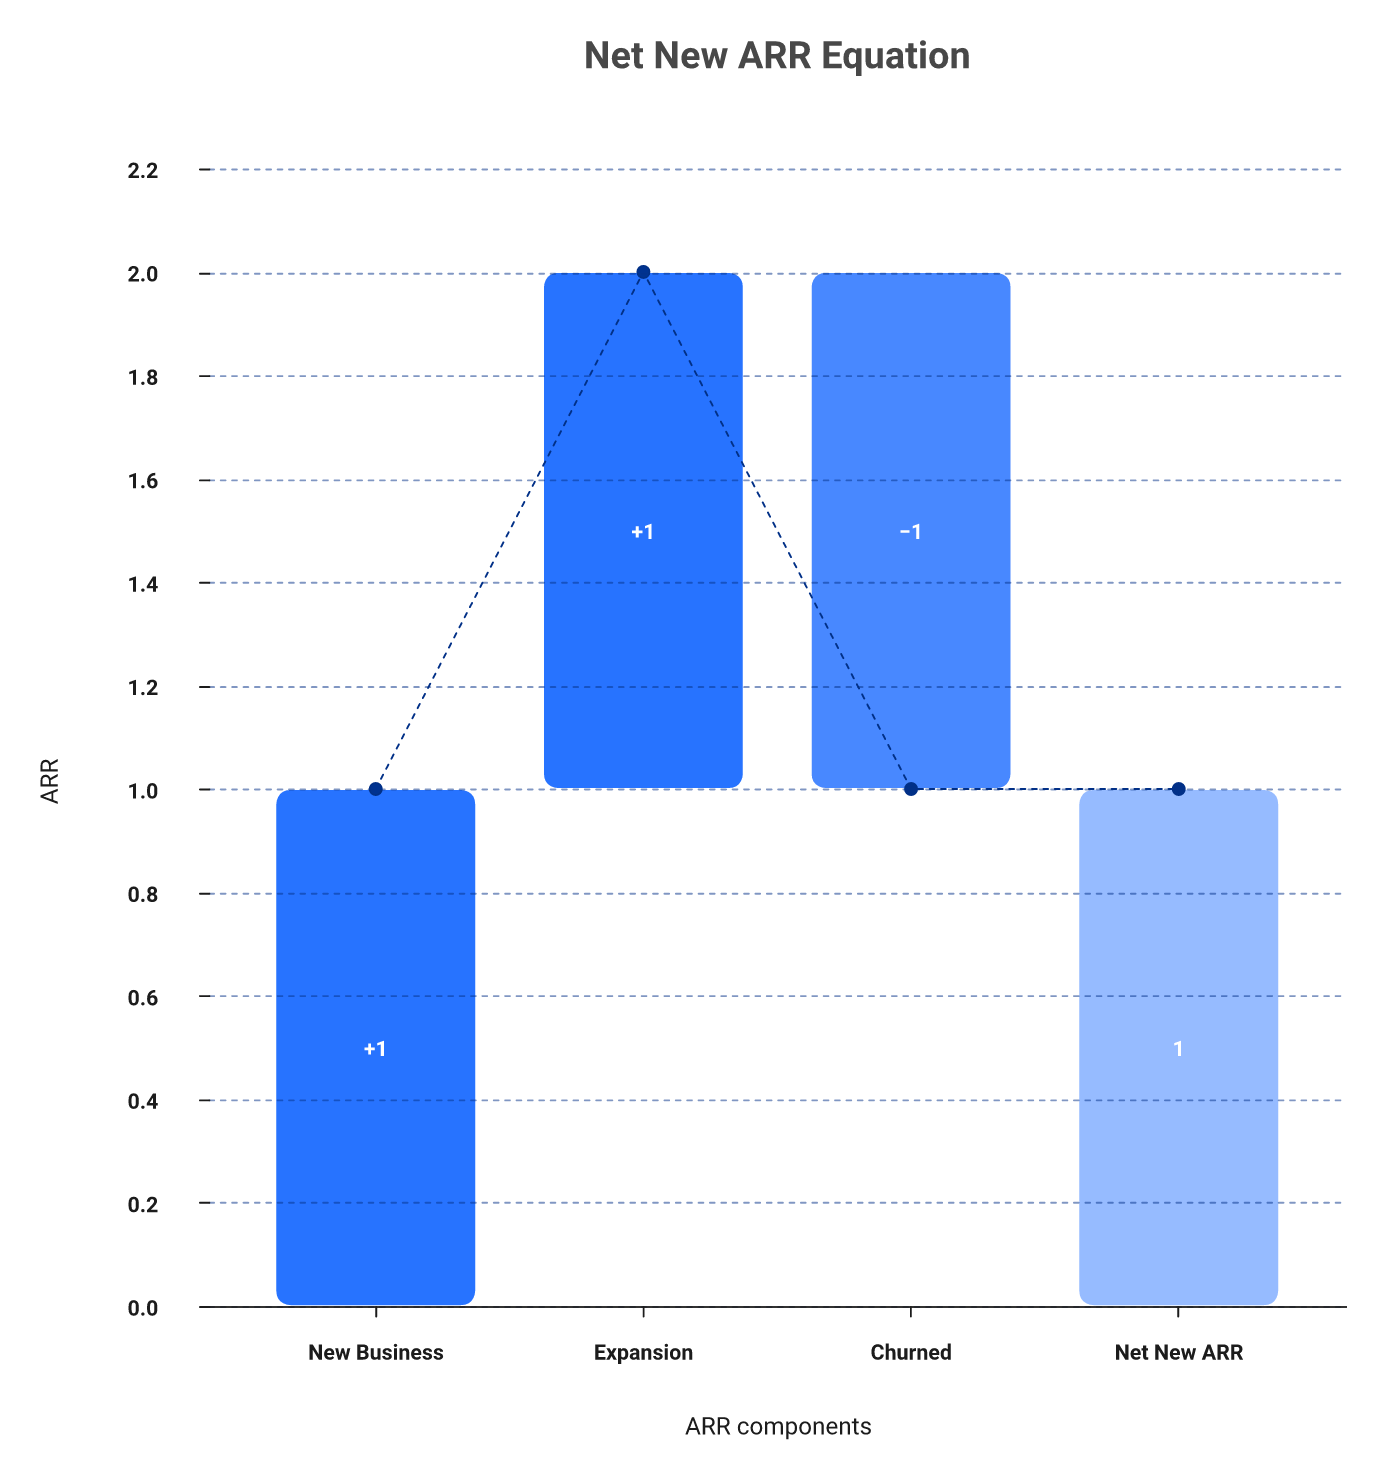
Run your last four quarters through it before reading another strategy list. If churned ARR is eating more than half of new ARR, acquisition spend is a leaky bucket subsidy.
💸 The pain: funding the front of the funnel while the back leaks
The most common pattern I see is a company at $6M ARR hiring two SDRs while gross retention sits in the low eighties. The SDRs work. The number still does not move, because every new logo replaces a lost one.
Bootstrapped firms in the $3M to $20M band run median gross revenue retention of 91% and NRR of 103%. If you are materially below that, acquisition is not your constraint.
📊 Stage gates that decide what gets funded
| ARR stage | Primary motion | Gate to clear before scaling spend |
| Under $2M | Founder-led sales, concentrated ICP content | Repeatable close pattern in one segment |
| $2M to $20M | Product-led funnel feeding outbound | Activation rate instrumented, GRR at or above 90% |
| $20M+ | Hybrid PLG plus enterprise sales, CS-led expansion | NRR above 105%, CAC payback inside 18 months |
Three numbers decide the gate. CAC payback tells you how long cash is out. LTV to CAC tells you whether the unit works. The Rule of 40, growth rate plus profit margin, tells you whether the market will fund it.
⚠️ None of these are targets. They are permissions. A 42% median growth rate at the 90th percentile of the bootstrapped cohort is what clearing the gates looks like, not what setting a goal looks like.
🔍 Where ICP definition actually comes from
Not from keyword tools. The most useful ICP evidence I have ever used came out of recorded sales calls, specifically the objection pattern in lost deals and the integration requirements buyers raised unprompted. That is also how question research should start.
Pull your last 40 Gong transcripts. Tag every objection, feature request, and integration ask. The clusters that repeat are your ICP's real evaluation criteria, and they rarely match the segments in your pitch deck.
That exercise usually kills one or two funded strategies outright. Any strategy that cannot name the buyer it serves and the objection it answers should not hold a budget line. If a channel cannot pass that test, it is a tactic wearing a strategy's clothes.
Q3. Why has pure product-led growth hit a ceiling, and what replaces it?
Pure PLG stalls because self-serve cannot close enterprise buyers who need compliance review, multi-department approval, and a named human. Product-led motions spread bottom-up in developer and individual-contributor tools. The deals carrying real ARR need sales. The 2026 pattern is hybrid: PLG for acquisition and activation, product-qualified-lead routing into humans for expansion and enterprise.
🚀 Why PLG won, and it genuinely did win
Between 2018 and 2023, product-led growth solved a real problem. Buyers wanted to try software before talking to anyone, and free tiers plus reverse trials gave them that. Developer tools and individual-contributor products spread sideways inside companies without a single call.
The motion was also beautifully measurable. Signups, activation, time to first value, and conversion all sat inside one dashboard. That measurability is part of why it got over-adopted.
⚠️ The complication: self-serve cannot close a whale
The ceiling shows up as a flat enterprise segment next to a healthy self-serve funnel. Enterprise buyers need security review, procurement, legal, and a multi-department sign-off. No onboarding flow handles that.
Ethan Smith at Graphite puts the structural version of this well. Meta wanted completely self-serve automated ads, and still built a giant account management team, because the money is in the whales and the whales need a person to talk to. Ten people can serve thousands of small businesses. The whales cannot be served that way.
Neil Patel's version is blunter. Enterprise companies do not care about hacks. The question on the table is how to go from $10 million to driving an additional $90 million a year, and no growth hack answers it.
✅ What replaces it: PLG as the top of a sales-assisted motion
The resolution is not abandoning PLG. It is demoting it from the whole strategy to the acquisition and activation layer, then routing qualified usage into humans.
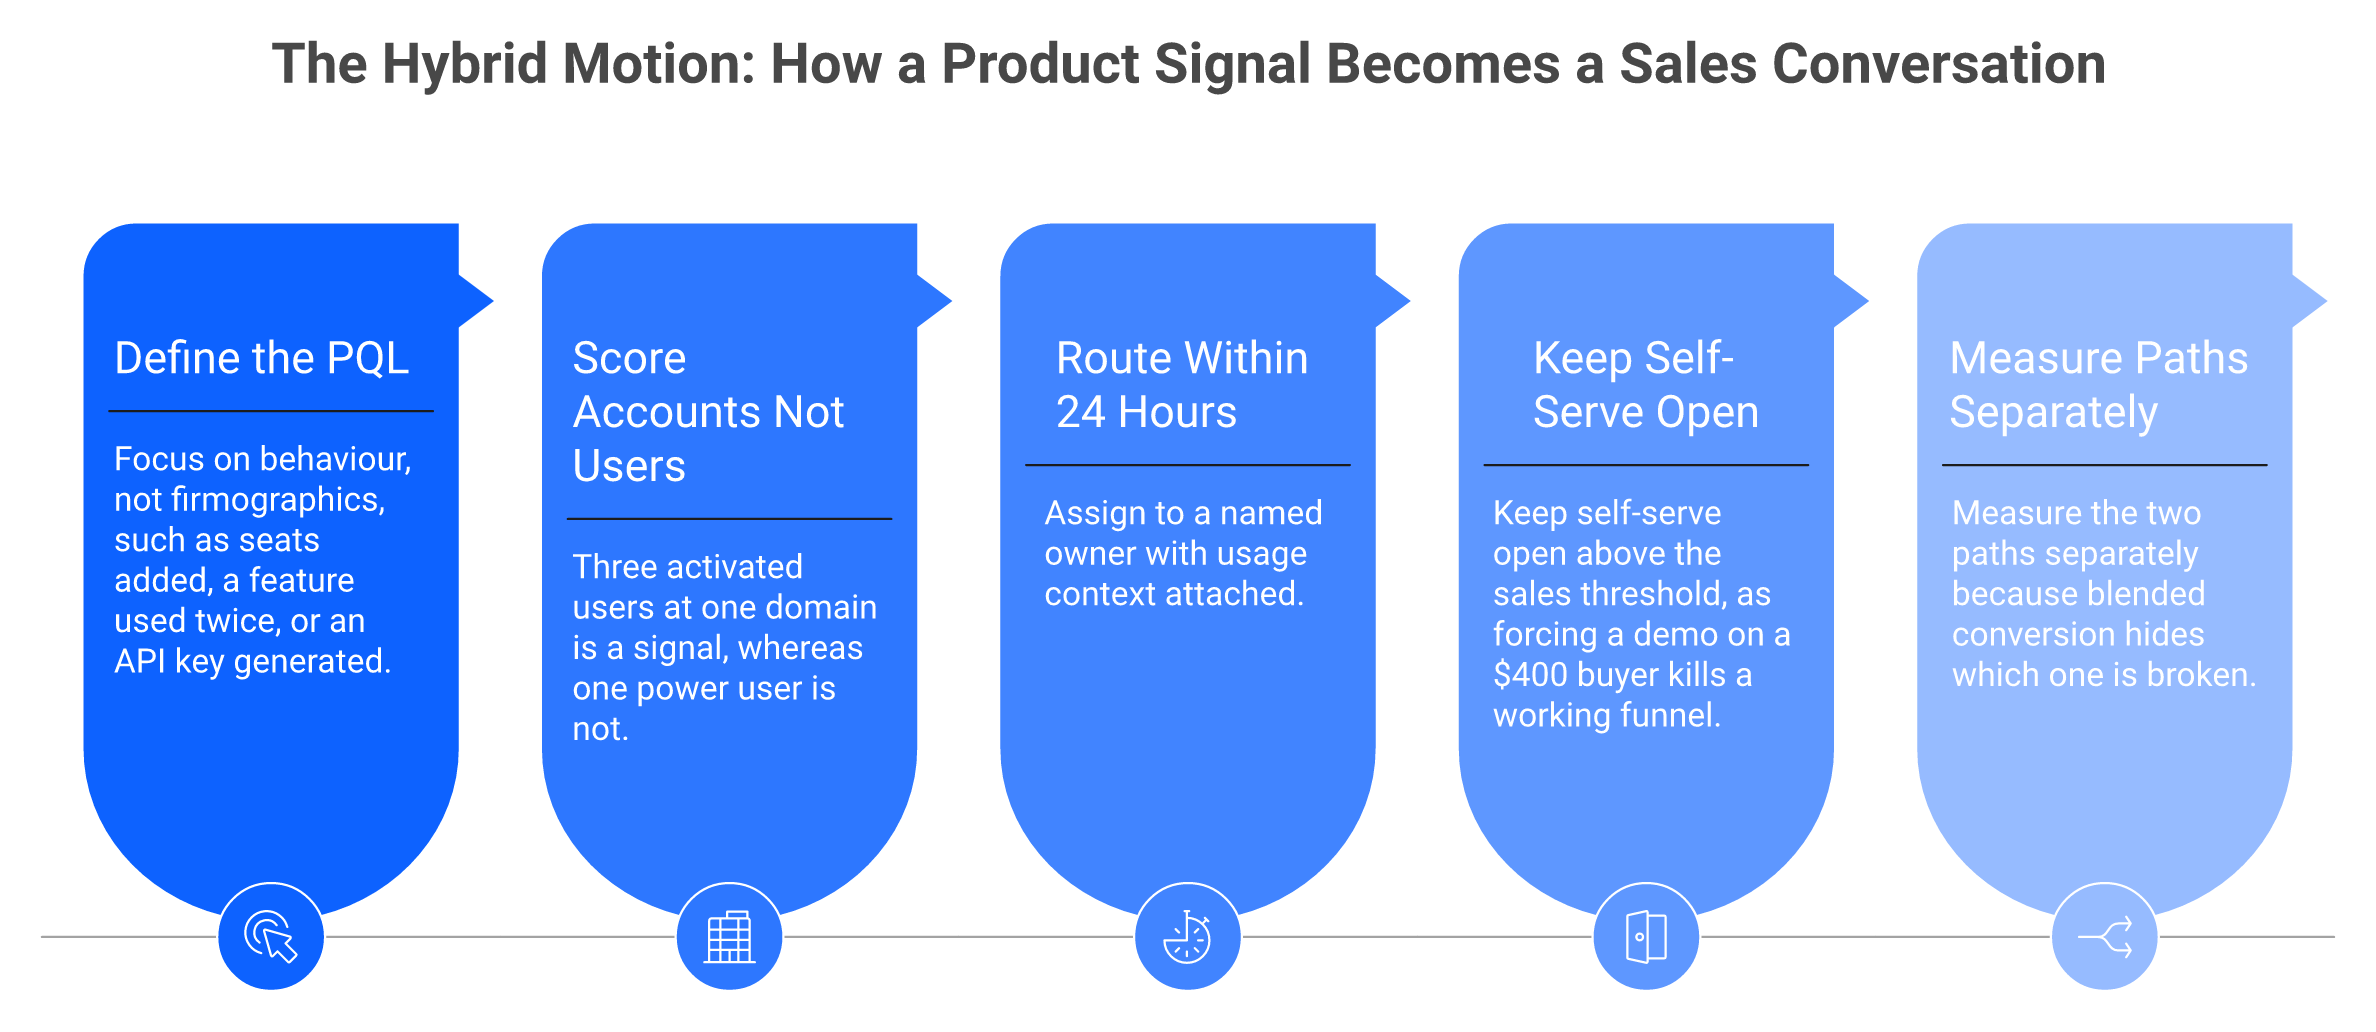
The mechanics look like this:
- Define a product-qualified lead (PQL) on behaviour, not firmographics. Seats added, a specific feature used twice, an API key generated.
- Score accounts, not users. Three activated users at one domain is a signal. One power user is not.
- Route PQLs to a named owner within 24 hours, with the usage context attached.
- Keep self-serve open above the sales threshold. Forcing a demo on a $400 buyer kills a working funnel.
- Measure the two paths separately. Blended conversion hides which one is broken.
🧷 The decision rule for adding the sales layer
Add it when deal size, not deal volume, becomes the constraint. Concretely: when your top decile of accounts by potential spend is converting at a materially lower rate than your median, you have a service problem, not a funnel problem.
The contested ground is real, and I want to be honest about it. Vercel, Webflow, and Drops show how far bottom-up adoption travels when the user is also the implementer. Rippling and enterprise security show the opposite, where the buyer, the user, and the approver are three different people.
My read is that growth teams over-index on the motion that is easiest to instrument rather than the one carrying revenue. PLG dashboards look healthy right up to the quarter the enterprise number misses, which is also why B2B SaaS demand capture deserves its own gate.
Q4. Why is pricing and packaging the highest-leverage growth lever?
Pricing compounds on the entire base, not just new logos. A 1% pricing improvement moves revenue roughly 12% to 13%, around four times the impact of an equivalent acquisition improvement. Packaging decides whether expansion happens automatically: usage-based and hybrid tiers convert growing accounts into expansion ARR without a new sale, which is why pricing tests outrank channel tests at most stages.
💰 The multiplier, and why it beats channel work
Acquisition improvements apply to next quarter's new logos. Pricing improvements apply to every account you already have, on the next renewal. That is the whole argument, and the arithmetic is not close.
Prospeo's 2026 benchmark analysis puts a 1% pricing improvement at roughly a 12% to 13% revenue effect, about four times the leverage of an equivalent gain in acquisition. Monetization, in their framing, outranks acquisition at most stages.
❌ The pain: pricing frozen while CAC climbs
Most teams I work with last changed pricing two to four years ago. Meanwhile paid CAC rose, sales cycles lengthened, and the product shipped six meaningful features that nobody charges for.
That gap is pure margin left on the table. It also distorts positioning, because price is the loudest signal a buyer reads about who the product is for.
📈 Packaging is what makes expansion automatic
The difference between flat-seat pricing and a usage-linked component is whether growth inside an account reaches your revenue without a renegotiation.
| Model | Expansion mechanism | Watch out for |
| Flat per-seat | Requires a new sale or seat request | Expansion stalls when headcount freezes |
| Usage-based | Scales with customer activity | Revenue becomes less predictable |
| Hybrid (platform fee plus usage) | Baseline plus automatic upside | Complexity in the sales conversation |
Paddle's monetization research makes the same structural point: distribution and monetization have to be built into the product, not bolted on afterward. Packaging is the product decision that growth teams rarely own and always inherit.
⏰ A 90-day pricing test that will not blow up the base
Here is the sequence I would run, with guardrails:
- Weeks 1 to 2: pull win and loss notes for discount requests and feature-gating objections. Identify the one gate buyers argue with most.
- Weeks 3 to 4: price-test on new business only. Grandfather the existing base. No exceptions.
- Weeks 5 to 8: measure win rate, ARPA, and sales cycle length together. A win rate dip with higher ARPA is often a net gain.
- Weeks 9 to 12: add one usage-linked component to the highest tier. Instrument it before you price it.
⚠️ One honest caveat. Pricing tests at low deal volume take longer to read than anyone wants. Below roughly 30 new deals a quarter, treat the result as directional, not conclusive.
🧭 Pricing as a positioning artifact
What you charge for tells buyers who the product is for. A per-seat model says "a team adopts this." A consumption model says "this is infrastructure." Those two sentences attract different buyers and produce different churn.
That signal now travels further than it used to. AI engines summarizing your category read pricing pages, tier names, and what sits behind each gate. Packaging language is category positioning, whether you intended it that way or not, which is why citation-worthy content starts with clarity.
MaximusLabs AI sees this on the citation side: when a pricing page states tiers, limits, and who each tier serves in plain text, it gets pulled into AI answers about the category far more often than a page that hides everything behind "Contact sales." We treat pricing clarity as an answer-engine asset, not just a conversion one, and the same principle drives our generative engine optimization work and the Oliv AI engagement.
Q5. How do you build a retention engine when churn is really a positioning failure?
Early churn plus constant requests for features you never plan to build is a positioning problem, not a roadmap gap. Fix the market framing first, then instrument expansion: activation to first value, usage-based expansion triggers, and involuntary-churn recovery. SaaS Capital's 2026 survey of more than 1,000 private B2B SaaS companies puts median net revenue retention at 103% and gross revenue retention at 91%, with the 90th percentile at 117.9%.
⚠️ The reflex: blame the roadmap
Churn spikes, and the first meeting is always with product. Someone pulls the exit-survey tags, and the top three reasons look like missing features. The roadmap gets reshuffled, and two quarters later the churn rate has not moved.
I have sat in that meeting more times than I would like. The tags are real. The diagnosis is usually wrong.
❌ The complication: you sold to people who misread you
April Dunford names the pattern precisely in Obviously Awesome. Customers who misunderstood your value chose you for the wrong reasons. Then they try to recover sunk costs by turning your product into what they thought they bought.
Net revenue retention (NRR) measures revenue kept plus expansion from existing accounts. Gross revenue retention (GRR) measures revenue kept with expansion stripped out. When GRR is weak and feature requests are chaotic, the acquisition filter is broken, not the backlog.
✅ Proof that repositioning, not shipping, fixes it
Wave had over 500,000 small businesses using free cloud accounting software by 2013, and advertising revenue still could not reach its targets. Kirk Simpson's framing of the fix was blunt. When they were "accounting software," customers struggled to understand that payroll and payments existed. Today they are "financial software." Wave went on to serve over 4 million customers tracking $200 billion in income and expenses.
Eloqua is the same story in a different category. A failed web chat tool became email tracking for "demand generators," then shifted its label from demand generation automation to marketing automation in 2006. Revenue moved from $12 million to $96 million before Oracle acquired it for $870 million.
📊 The engine, and the elasticity that pays for it
Once framing is right, retention becomes mechanical. Four components carry most of the load:
- Activation to first value, measured in days, not signups.
- Usage-based expansion triggers that fire before a renewal conversation.
- Involuntary churn recovery (failed cards, expired payment methods).
- A named owner for the expansion number, separate from support.
| Metric | Median | 90th percentile |
| Net revenue retention | 103% | 117.9% |
| Gross revenue retention | 91% | Higher band |
| Growth rate ($3M to $20M ARR) | 15% | 42.3% |
SaaS Capital's data shows the elasticity clearly. Moving NRR from the 90% to 100% band into the 100% to 110% band adds roughly five points of growth, and the highest-NRR cohort grows about 173% above median. That is a demand-gen result produced by a retention team.
🎯 Positioning is the moat, not the accelerant
MaximusLabs AI starts positioning work with the leadership team rather than a keyword tool. Our Founder's Voice process exists to capture how the founder frames the market, because that framing is what every page then has to reflect consistently. Get it wrong and you acquire buyers who churn. Get it right and the same content compounds into expansion.
My own read, and I hold it loosely, is that brand clarity outranks algorithm skill here. A misaligned buyer churns whether an AI engine sent them or Google did, which is why competitive positioning work comes before any channel decision.
Q6. Where did 20-40% of your inbound pipeline go, and how does the AI sample set decide who gets evaluated?
It was absorbed by AI answers. Pew Research tracked 68,879 searches and found clicks on traditional results fall from 15% to 8% when an AI summary appears, with in-summary links clicked in just 1% of visits. MaximusLabs AI calls what replaced it the sample set gate: AI engines return 5 to 15 names, that list becomes the evaluation set, and omission removes a vendor from the buying conversation regardless of product quality.
⏰ The situation: a channel that used to be predictable
For a decade, organic search was the most forecastable line in the plan. Rankings moved slowly, click-through rates were stable, and pipeline followed sessions with a lag you could model.
That predictability is why so many boards treated SEO as infrastructure. You funded it, and it kept producing.
📉 The complication: the clicks stopped arriving
Pew's July 2025 analysis of 68,879 Google searches from 900 US adults is the cleanest primary evidence available. When an AI summary appears, traditional result clicks drop from 15% to 8%. Links inside the summary get clicked in 1% of visits. Around 26% of those sessions end entirely.
Ahrefs measured the same squeeze from the ranking side, with position-one click-through rate down 34.5% on informational queries carrying an AI Overview. Operators running mature programs report 20% to 40% organic declines depending on industry. Sam Lessin described it on My First Million as traffic that used to come predictably, including to teams as good at SEO as HubSpot, falling by about 20% to 40%. We track the pattern in our search referral traffic decline research.
🎯 What replaced it: the sample set gate
Google listed hundreds of alternatives per category. An AI answer names a handful. That handful is the consideration set.
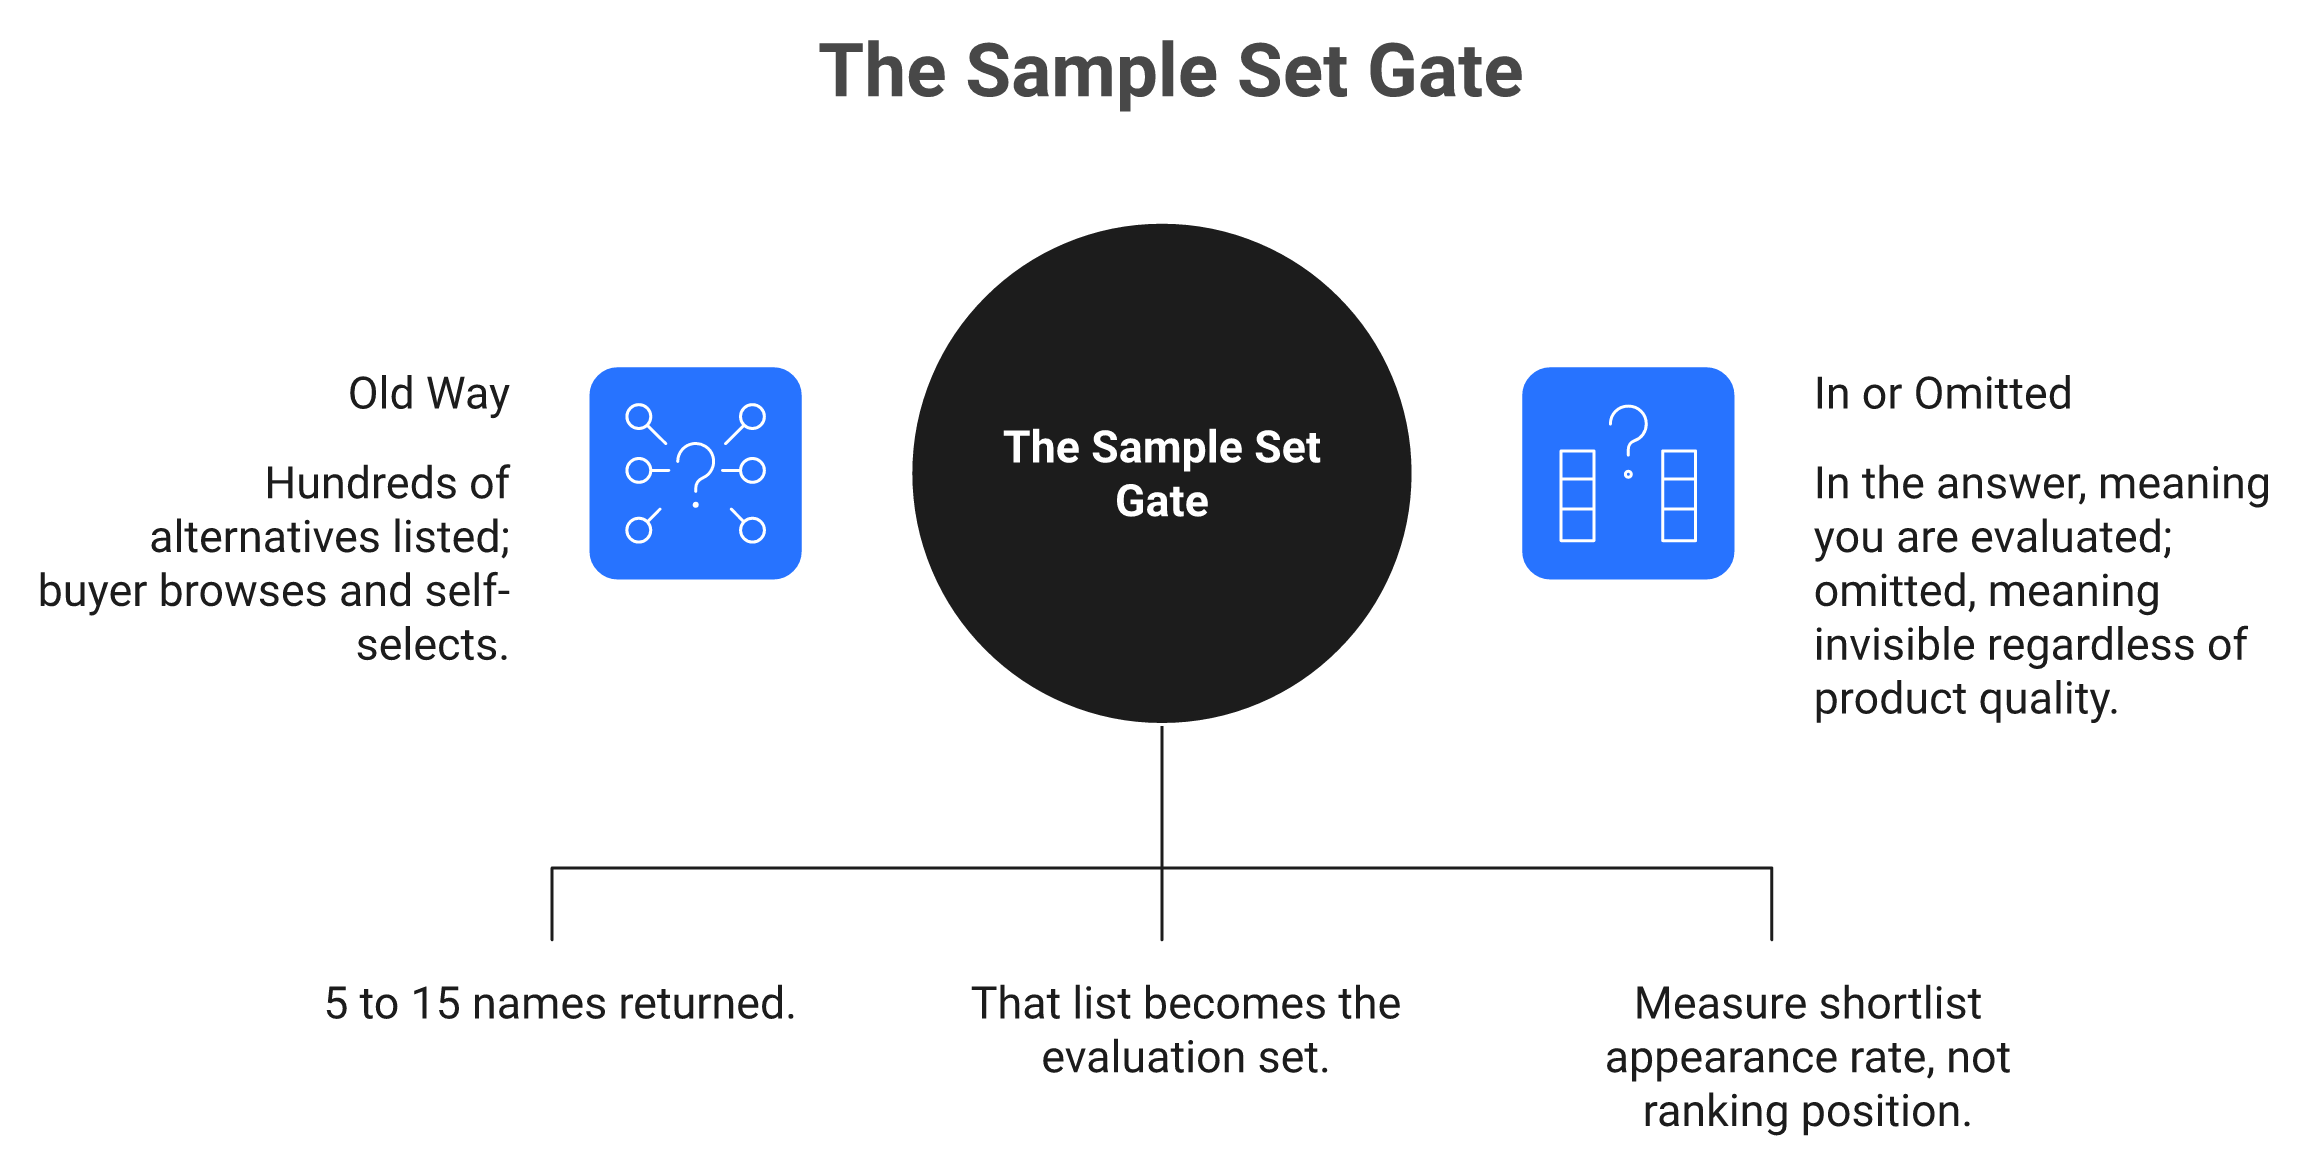
Pew found 88% of AI summaries cite three or more sources, so shortlist membership is contested query by query, not won once sitewide. B2B makes this harder. As Ethan Smith puts it, a Director of Finance is not changing banks every week, so the buyer is not searching for your product today, but eventually makes a decision. You need to be in the answer on the day that decision starts.
This is where Answer Engine Optimization (AEO) differs from traditional SEO. Ranking a blue link is no longer the job. Becoming the cited answer is.
📊 How MaximusLabs measures shortlist presence
MaximusLabs AI runs AI source analysis as a standing workflow, not a one-time audit. We build prompt sets across ChatGPT, Claude, Perplexity, and Gemini, map the top-cited URLs for each query, and track share of voice across thousands of question variants instead of single rankings. For Oliv AI, that produced a 64% AI citation rate in 6 months, versus roughly 30% for billion-dollar incumbents more than a decade older. Oliv AI also reports 30-40% of inbound now AI-sourced.
✅ Your Monday-morning baseline
Write 30 questions your ideal customer would actually type. Mix category queries, comparison queries, and problem queries. Run all 30 across four engines, and record two numbers: whether your brand appears, and which sources the engine cited instead.
That gives you a shortlist appearance rate. Mentions alone are still a vanity metric, so pair it with assisted pipeline before anyone calls it a win.
Q7. Which 5% of your pages drive 85% of pipeline, and what should you stop publishing?
Across SaaS portfolios including Webflow, Upwork, Notion, and Rippling, Graphite found 19 of 20 landing pages drive little to no traffic while 1 in 20 drives roughly 85% of it. Concentrate on archetypes with proven pull: technical documentation, integration pages, and comparison pages, which are cited at 34% to 41% versus 15% to 18% for blogs. Stop mass-producing top-of-funnel "what is" posts that AI answers natively.
📊 The ratio that should reset your content budget
Ethan Smith's portfolio data is the most useful number in content strategy right now. Nineteen of twenty landing pages drive little to no traffic. One in twenty drives about 85% of it.
That is not a reason to publish less. It is a reason to publish into the archetypes that win, and to stop defending the ones that never will.
❌ The treadmill nobody wants to kill
Most content calendars I audit still run on "what is" explainers. They were defensible when Google rewarded topical coverage. They are now the exact query AI engines answer without sending a click.
Bottom-of-funnel (BOFU) content targets buyers ready to choose. Top-of-funnel (TOFU) content targets people learning a term. Only one of those converts, and only one of those is still cheap to win, which is the whole basis of our AI content strategy planning.
✅ Which archetypes actually earn citations
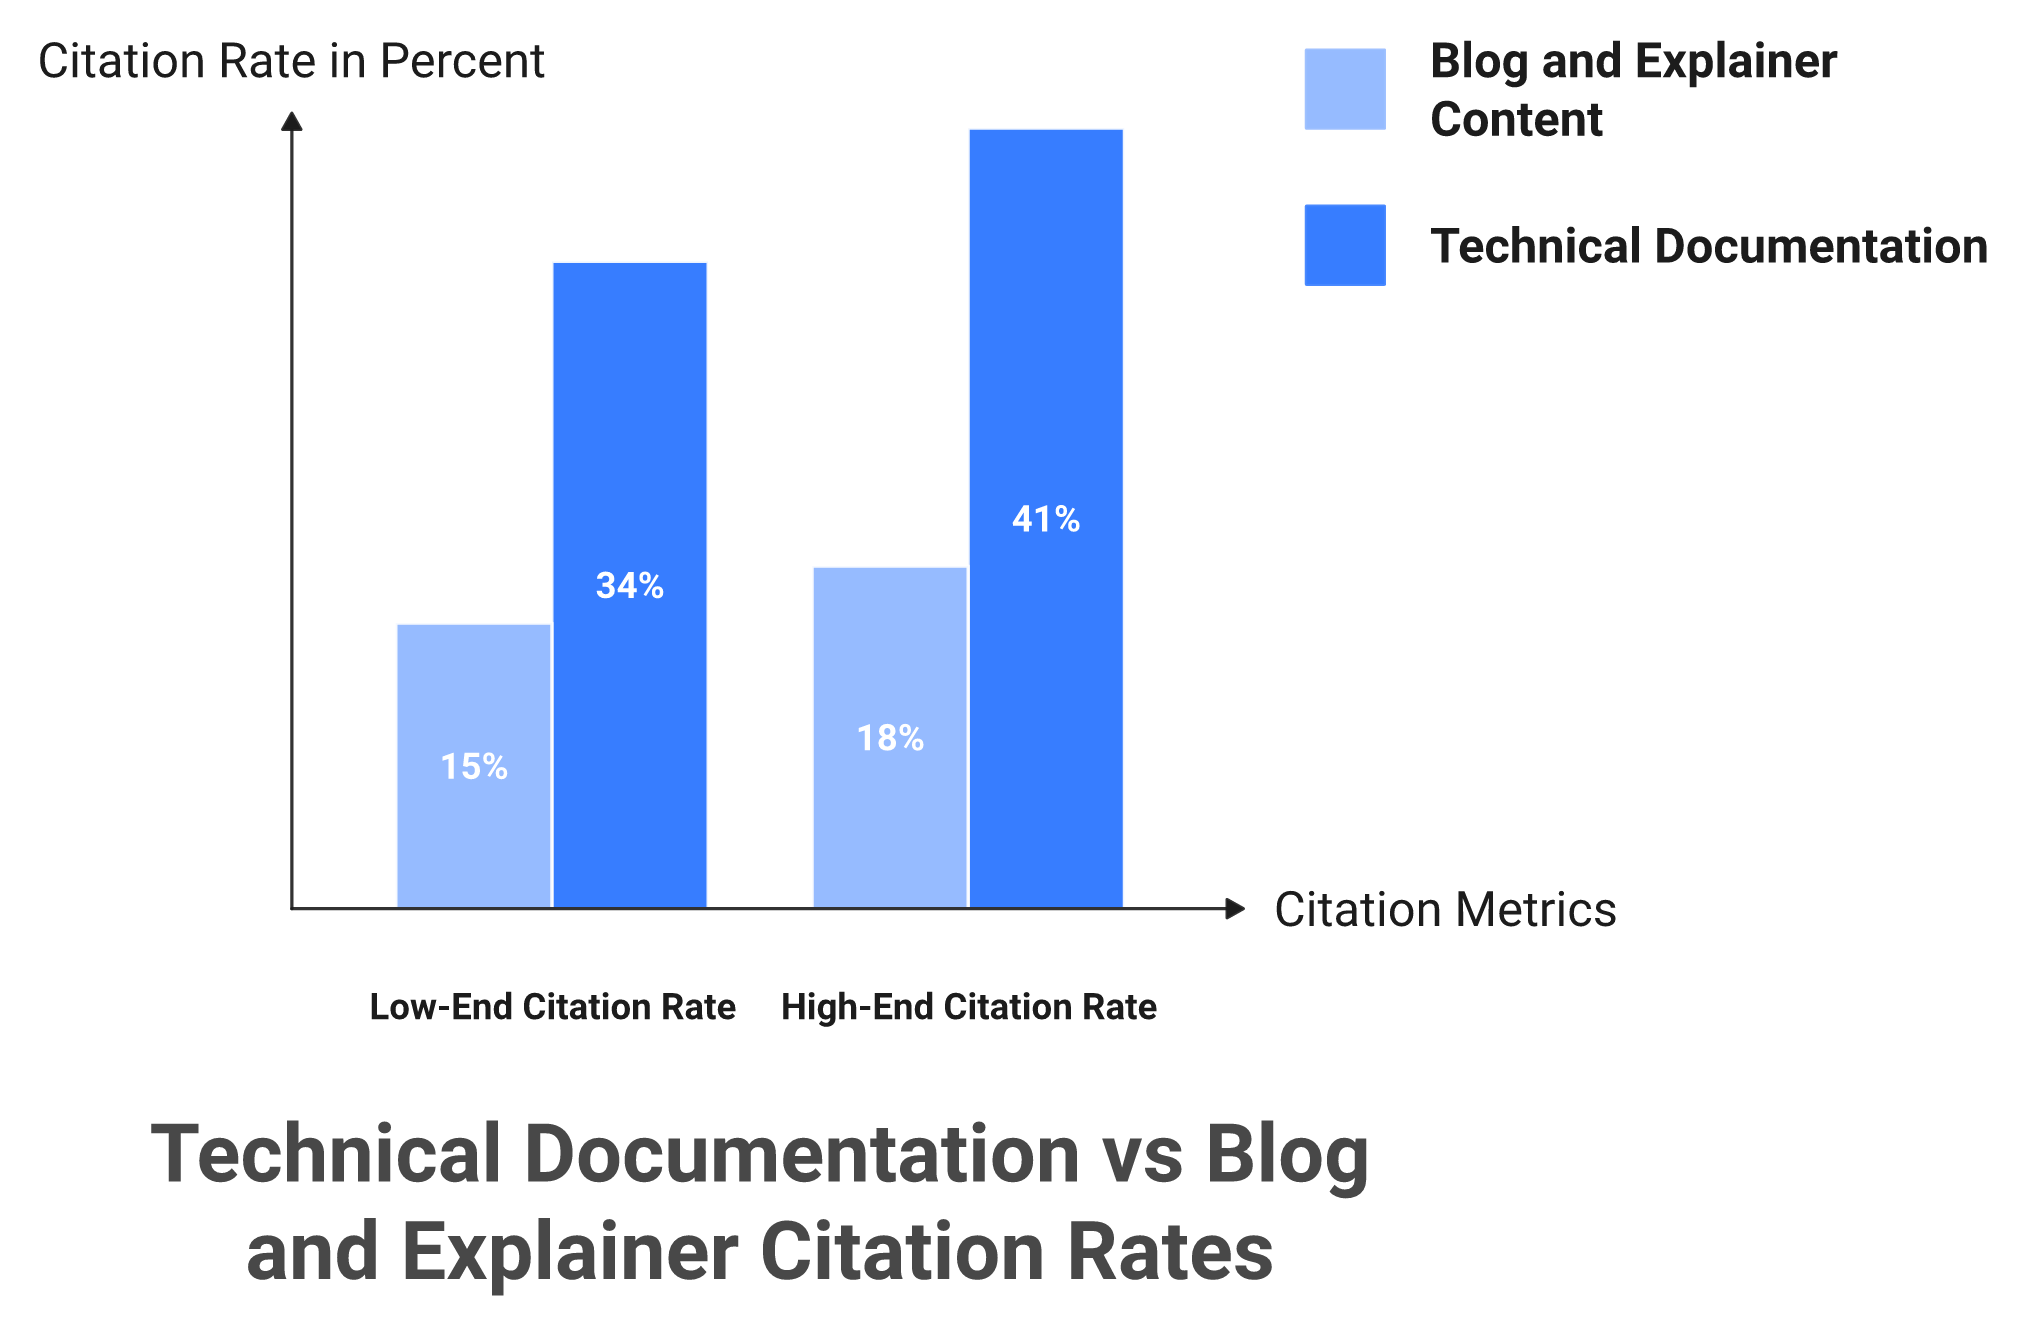
Technical documentation reaches a median citation rate of 34% to 41% in B2B AI search, against 15% to 18% for blog posts, and documentation accounts for about 29% of all B2B citations. Semrush's January 2026 analysis of 5 million URLs cited by ChatGPT Search and Google AI Mode adds the behavioural half: top-cited pages also show longer visit duration, lower bounce, and better conversion.
| Page archetype | Why it earns citations | Fund it? |
| Onboarding and API docs | Answers task queries natively | ✅ Yes, first |
| Integration pages ("X with Y") | Long-tail, specific, low competition | ✅ Yes |
| Comparison and alternatives | Matches evaluation-stage questions | ✅ Yes |
| TOFU "what is" explainers | AI answers it without a click | ❌ Stop |
⚠️ One honest caveat on automation. Graphite tested thousands of keywords comparing human and AI-generated content, and the pattern was that heavier human editing lifted rankings each time. Fully automated output underperformed.
💰 Why unit economics decide whether you can obey the rule
MaximusLabs AI sequences BOFU first, moves to middle-of-funnel only after BOFU is exhausted, and skips TOFU on purpose. Our cost per piece runs near $60, against roughly $800 in-house and $260 at a traditional agency, which is what makes the 5% rule survivable in practice.
| Model | Cost per piece | Revenue focus |
| In-house team | ~$800 | Depends on team |
| Traditional agency | ~$260 | Rarely |
| MaximusLabs AI | ~$60 | Always |
⏰ The review cadence that enforces it
Every 90 days, pull every page published in the prior two quarters. Sort by assisted pipeline, not sessions. Kill the bottom half, and rebuild the top decile into deeper versions, which is the same logic behind a disciplined GEO content refresh.
Drops is the proof that the winners are unpredictable. Its programmatic language pages launched in June 2019 against 100 to 200 clicks a day, and captured thousands of keywords tools had scored at zero volume.
Q8. Owned or earned: should you build documentation or win G2 and Reddit?
Both, split by query type. Long-tail queries like "how to integrate X with Y" are won natively by owned docs, feature pages, and integration pages. Head category queries like "best CRM software" are dominated by third parties: roughly 85% of brand mentions come from external sources, and the G2, Capterra, Software Advice, and GetApp family controls about 84% of B2B review citations.
🎯 The allocation rule, stated plainly
Query shape decides who wins. Specific how-to questions reward whoever documented the task. Category shortlists reward whoever the aggregators and communities already vouch for.
| Query type | Winning surface | What to build |
| "How to integrate X with Y" | Owned | Docs, integration pages, API reference |
| "Best [category] software" | Earned | G2 and Capterra profiles, Reddit presence, listicles |
| "X vs Y" | Mixed | Owned comparison page plus third-party reviews |
| "Is X worth it" | Earned | Community threads, verified reviews |
❌ The failure mode: great docs, invisible category
The most common gap I see is a team with genuinely excellent documentation that never appears for its own category query. They optimized the website, and ignored the rest of the web.
That is the structural limit of a Google-only playbook. Traditional SEO retainers scope work to your domain. The citation now lives somewhere you do not own, which is why citation acquisition tactics sit outside the site itself.
📊 The evidence: mentions beat links for AI visibility
Brand web mentions, both linked and unlinked, correlate with AI Overview visibility at a Spearman coefficient of 0.664, against 0.218 for backlinks. That is roughly three times stronger. Pew's data adds that Wikipedia, YouTube, and Reddit together appear in about 15% of AI summaries.
Webflow turned this into signups rather than impressions. It produced 800-plus task-focused YouTube tutorials, and team members answered Reddit questions with full identity disclosure. The result was 8% of total signups from LLM discovery.
✅ What earned-side work actually looks like
MaximusLabs AI treats off-site presence as infrastructure, not outreach. We run review platform optimization across G2, Capterra, and Gartner with 10 or more reviews per site, identify the exact Reddit and Quora threads engines already cite, and publish founder insight on LinkedIn Pulse. Nidra Goods ranked first on Google, ChatGPT, and Perplexity for "best sleep mask" off a single strategy built this way.
Most agencies run only the owned half. MaximusLabs AI runs both pillars, Owned AEO where your content becomes the answer, and Earned AEO where reviews, Reddit, press, and listicles make engines trust you.
⏰ A two-track quarterly plan
Run both tracks in parallel, with separate owners:
- Owned track: ship one documentation cluster and three integration pages per quarter.
- Earned track: 10 verified reviews per platform, plus participation in the five threads your prompt-set audit flagged as cited.
- Shared track: one comparison page per top competitor, linked from docs.
⚠️ The honest limit here is timing. Earned signals compound slowly, and nobody should promise a citation lift inside 30 days. What MaximusLabs measures is pipeline influence over quarters, not mentions in a dashboard.
Q9. Should an early-stage SaaS invest in SEO at all, or go AEO-first?
AEO first. Traditional organic search needs years of accumulated domain authority that a seed-stage company does not have, which is why experienced operators tell early startups to skip SEO entirely. Answer engine optimization has no authority gate, because a citation can be earned tomorrow and surface immediately. Webflow measured 6x higher conversion from LLM-referred visitors, and Vercel attributes 10% of new signups directly to LLM discovery.
⏰ The reflex: hire an SEO agency at seed
The pattern is almost automatic. A startup closes a seed round, and content lands in the first 90-day plan. A retainer gets signed, a keyword map arrives, and 20 blog posts go into the queue.
Twelve months later, traffic is up and pipeline is flat. The posts rank for terms nobody buys from.
❌ The complication: the authority gate is real
Eli Schwartz describes this honestly in Product-Led SEO. He started his first B2B SaaS SEO engagement expecting a profitable channel, then hit a wall of reality he had to explain to a disappointed client. A product sold to a narrow B2B audience does not create new demand just because SEO best practices improve.
Ethan Smith is blunter. When startups ask him for SEO help, his first response is often to not do it at all, because you cannot grow search early without enough domain authority. Domain authority is the accumulated trust a domain earns over years of links and coverage. You cannot sprint it, which is why GEO for SaaS startups runs on a different clock.
✅ What changed: citations have no waiting period
AEO is different in one structural way. You can be mentioned by a citation tomorrow and start showing up immediately, because the engine is selecting trusted sources per query, not ranking a domain.
The value of that traffic is also higher. Semrush found AI search visitors convert at 4.4 times the value of traditional organic visitors. Webflow measured a 6x conversion gap between LLM traffic and Google search traffic, and now attributes 8% of total signups to LLM discovery. Vercel puts its figure at 10% of new signups.
⚠️ This is not a magic trick. Citations compound with trust and verifiable sourcing, and traditional SEO still carries the foundation underneath. What changes is the order of operations, and our answer engine optimization engagements are sequenced that way.
📊 Why MaximusLabs was built on this asymmetry
MaximusLabs AI was built on exactly this gap. Krishna Kaanth joined WiseMonk as its second employee heading go-to-market, where SEO drove 98% of revenue, and found that what ChatGPT treats as important is not what Google or Perplexity treat as important. We front-load AI visibility as a result: technical audit in week one, client-approved keywords, first GEO article live by day four. UnderDefense now competes against multi-deca-billion-dollar cybersecurity incumbents on that basis.
🎯 What an AEO-first 90 days actually funds
Instead of 20 blog posts, fund this:
- A prompt-set baseline across ChatGPT, Perplexity, Gemini, and Claude, recording who gets cited today.
- Six to eight bottom-of-funnel pages mapped to the questions your buyers ask those engines.
- A documentation and integration cluster that answers task-level queries natively.
- Ten verified reviews each on G2 and Capterra, because engines read third-party surfaces.
- Entity basics: Organization schema, consistent naming, and crawler access.
My own hedge, held honestly: this works best when a real buyer is already asking AI engines about your category. If nobody is searching for the problem yet, no amount of AEO manufactures demand. That is a demand-creation job, and it belongs to outbound or PR.
Q10. What technical infrastructure makes your SaaS discoverable to AI engines?
Four layers matter: structured data (Organization, Article, Product, FAQ), a closed sameAs entity loop linking to Wikidata, Crunchbase, LinkedIn, and G2, AI crawler access in robots.txt with critical content rendered in HTML, and direct answer blocks of 30 to 60 words placed in the first 30% of page text. Semrush's analysis of 5 million cited URLs found top-cited pages also carry longer sessions and lower bounce, so engagement is part of the infrastructure.
🎯 The four layers, in build order
Structured data is code that tells engines what a page is about. Start with Organization and Article, then add Product and FAQ where they apply, following Google's structured data guidelines and Schema.org definitions.
A sameAs entity loop connects your Organization schema to the places that already describe you: Wikidata, Crunchbase, LinkedIn, and your G2 profile. Wikidata even carries a G2 Product ID property (P12136), which closes the loop cleanly, and that is the core of entity optimization.
❌ The pain: hygiene nobody funds
This work sits in a budget no-man's-land. Content owns the calendar, engineering owns the sprint, and schema belongs to neither. So it never ships.
Meanwhile competitors with weaker products get cited, because their pages are machine-readable and yours are not. Traditional Google-only retainers rarely touch this layer, since it produces no ranking chart to screenshot. A proper technical GEO implementation starts here instead.
📊 The evidence on format and crawler access
Semrush analyzed 5 million URLs cited by ChatGPT Search and Google AI Mode in January 2026. Top-cited pages showed longer visit duration, lower bounce rates, and better conversion across all traffic sources. Format and behaviour both matter.
Placement matters too. Pages that lead with a direct answer block, a 30 to 60 word answer in the first 30% of the text, carry a 44.2% citation share in B2B AI search. Two mechanical fixes follow:
- Unblock GPTbot and oi-searchbot in robots.txt, so engines can read you at all.
- Minimize JavaScript so critical content renders in HTML, not after a script runs.
⚠️ The trust gap is your real differentiator
Pew surveyed 5,153 US adults in October 2025. Around 65% encounter AI summaries at least sometimes, only 20% find them extremely or very useful, and 53% report some trust. People see these answers. They do not fully believe them.
That gap favors sources an engine can defend. Named authors, dated claims, and verifiable primary sources are now citation criteria, not editorial polish. Stop optimizing for Google, and start optimizing for trust, because an engine stakes its own credibility when it recommends you. That is the whole premise of E-E-A-T optimization.
✅ How MaximusLabs ships this layer
MaximusLabs AI treats this as standard technical work, not an upsell. We ship schema for AI discoverability, minimize JavaScript so critical content renders in HTML, unblock GPTbot and oi-searchbot, rebuild blog templates with table of contents and schema integration, and embed E-E-A-T across the architecture rather than bolting it onto bylines. Every article then carries a 40 to 80 word answer nugget built to survive extraction with no surrounding context.
🧭 The honest limit
Infrastructure makes you eligible. It does not make you chosen. MaximusLabs AI has seen clean schema produce no citation lift when the underlying content answered nothing a buyer asked, which is why we sequence positioning and BOFU content first, then wire the technical layer underneath.
Q11. How do you measure AI-driven growth when GA4 reports it as "Direct"?
Most AI search influence never appears as a referral, because the citation is read and not clicked. Pew found in-summary links are clicked in just 1% of visits, so GA4 files the influence under Direct or Branded Search. The workable stack is a post-conversion "How did you hear about us?" field, custom GA4 channel groups for ChatGPT, Perplexity, Gemini, and Copilot, and prompt-set share-of-voice tracking.
🎯 The stack, stated first
Three instruments, in this order:
- A self-reported attribution field at signup or checkout, asking how the buyer heard about you.
- Custom channel groups in GA4 for the four main AI referrers, defined by hostname.
- A prompt-set audit re-run monthly, recording shortlist appearance and which sources got cited instead.
Google Analytics 4 documentation supports custom channel grouping by source and medium, so step two is a configuration task, not an engineering project. Our GEO measurement framework starts from the same three instruments.
❌ The pain: a board question with no answer
The scene repeats across every pipeline review. Someone asks what AI search contributed, and the only honest answer is that Direct traffic grew 40%.
Self-reported attribution closes most of that gap. It captures the roughly 90% of AI influence that GA4 misfiles, because the buyer remembers the ChatGPT conversation even when the analytics does not record it. That is also why revenue attribution for GEO cannot run on sessions alone.
📊 Why volume reporting understates you twice
Pew's July 2025 data shows in-summary links get clicked in 1% of visits. So the citation does its persuasion work without generating a session.
Then Semrush's finding compounds it: AI search visitors convert at 4.4 times the value of traditional organic visitors. Fewer visits, higher intent. Reporting sessions alone misses both halves, which is why revenue per visit belongs next to organic in every dashboard.
💸 The tool trap worth avoiding
There are now dozens of AEO rank trackers charging hundreds to thousands of dollars a month. Ethan Smith's assessment is worth quoting on the structure of that market. Graphite maintains a page with 60-plus AEO tools, and they all do the same thing, which is tracking. His advice is to pick the cheapest one that does what you need, because in two years you will probably be using Ahrefs anyway. Our own AEO tools comparison reaches the same conclusion.
⚠️ The deeper point is causal, not financial. Knowing what you rank does not cause an outcome. Tracking tells you where you stand, and content, reviews, and docs are what move it.
✅ What to ship this week
- Add one required field at signup: "How did you hear about us?" with a free-text option.
- Create GA4 channel groups for chatgpt.com, perplexity.ai, gemini.google.com, and copilot.microsoft.com.
- Build a 30-question prompt set, run it monthly, log appearance rate and cited sources.
- Report three numbers to the board: shortlist appearance rate, assisted pipeline, and revenue per AI-sourced visit.
🧭 Measure shortlists, not ranks
MaximusLabs AI measures visibility across thousands of question variants rather than single rankings, because an AI shortlist is contested query by query. We run that tracking daily and regression-test it, then tie the result back to pipeline. Mentions on their own are a vanity metric, and MaximusLabs is held to the pipeline number instead.
Q12. What does a 90-day SaaS growth operating plan look like?
Days 1 to 14: run an ICP and positioning audit against your churn cohort, a technical and schema audit, and a prompt-set baseline across four AI engines. Days 15 to 45: ship BOFU pages and a technical documentation hub, add the "How did you hear about us?" field, and open G2 and Capterra review loops. Days 46 to 90: run a pricing and packaging test, wire expansion triggers to NRR, and retire the bottom 95% of pages.
⏰ Why order beats breadth
Ninety days is enough to fix sequence, not enough to fix everything. Every phase below gates the next one, so skipping ahead wastes the spend that follows.
| Phase | Work | Output |
| Days 1 to 14 | Positioning audit, technical and schema audit, prompt-set baseline | A diagnosis, not a plan |
| Days 15 to 45 | BOFU pages, documentation hub, attribution field, review loops | Assets that can be cited and measured |
| Days 46 to 90 | Pricing test, expansion triggers, page retirement | Revenue motion, not just coverage |
Build the documentation hub first inside phase two: onboarding guides, feature reference pages, integration guides, and API docs. Those earn citations at the highest rate of anything you publish, and they anchor a durable GEO strategy framework.
🎯 Stage adjustments that actually change the plan
- Under $2M ARR: skip the pricing test. Spend phase three on founder-led sales motion and ICP concentration instead.
- $2M to $20M ARR: run all three phases as written, and instrument activation before adding acquisition spend.
- $20M+ ARR: add an enterprise routing layer in phase two, and give expansion its own named owner.
📊 The gating metrics
Four numbers decide whether phase three gets funded:
- Activation rate, measured as days to first value.
- Net revenue retention, benchmarked against the 103% median and 117.9% at the 90th percentile.
- Shortlist appearance rate across your 30-question prompt set.
- CAC payback, inside 18 months before you scale spend.
❌ What stays unfunded
- Fully automated AI content. Graphite's keyword testing showed output improved the more humans edited it, and unedited AI pages underperformed.
- Chained API workflows sold as an agency. They produce cheap C-plus output that enterprise buyers reject.
- Pure self-serve motions aimed at enterprise whales.
- Growth hacks. Enterprise buyers ignore them, because the question is how to add the next $90 million, not how to game a funnel.
- Commodity AEO rank trackers beyond the cheapest one that works.
✅ How MaximusLabs runs the same sequence
MaximusLabs AI runs this as a standing phase model: technical SEO sprint in week one, BOFU-only content through months one to three, MOFU expansion only after BOFU is exhausted, then continuous AI source analysis and citation strategy. Onboarding takes two days, the first article can be live on day four, and every piece clears a ten-dimension quality scorecard with a 70 out of 100 publication floor. For Oliv AI, that sequence produced 27 qualified leads, $47K+ pipeline, 26% close rate in 4 months.
🧭 Your Monday-morning first move
Pick one thing: run the 30-question prompt set. It takes an afternoon, costs nothing, and tells you whether you are in the sample set your buyers already see.
The plan above is published on purpose, because a founder should be able to run it without us. What MaximusLabs AI adds is the sequencing discipline and the execution speed, not secret knowledge. If you want that run alongside your team, talk to us.
Frequently asked questions
What are SaaS growth strategies, and which ones actually work in 2026?
SaaS growth strategies are funded, stage-specific bets on how a company acquires, activates, retains, and expands recurring revenue. They are not tactics. A strategy survives a quarter of ambiguity; a tactic gets tested in an afternoon. Five engines carry the weight in 2026: • ICP and positioning: who you sell to, and how they understand you. • Pricing and packaging: revenue per account, plus the expansion path. • Hybrid product-led plus sales-assisted motion: how deals get sourced and closed. • Retention and expansion engine: whether revenue compounds or leaks. • Multi-surface AI answer visibility: whether buyers find you at all. Median private B2B SaaS growth fell to 22% from 25%, which punishes breadth. Eleven funded bets across a team of six means nothing gets a fair trial. Two of those engines create demand. Three capture or protect it. Outbound, PR, and advertising create demand that did not exist. Search, answer engines, and reviews harvest intent that already does. MaximusLabs AI sequences client work the same way, with revenue-focused content first and vanity metrics explicitly excluded. If AI answer visibility is the engine you have not funded yet, start with our AI search strategies hub.
How should I sequence SaaS growth strategies by ARR stage?
Sequence by stage, not by popularity. Each stage has one primary motion and one gate to clear before you scale spend. • Under $2M ARR: founder-led sales plus concentrated ICP content. Gate: a repeatable close pattern in one segment. • $2M to $20M ARR: a product-led funnel feeding outbound, with activation instrumented. Gate: gross revenue retention at or above 90%. • $20M+ ARR: hybrid product-led plus enterprise sales, with customer-success-led expansion. Gate: NRR above 105% and CAC payback inside 18 months. At every stage, the arithmetic is the same. Net new ARR equals new business plus expansion minus churned revenue. Two of those three terms live after the sale, so plans that only fund acquisition are optimizing a third of the equation. Three numbers decide each gate. CAC payback tells you how long cash is out. LTV to CAC tells you whether the unit works. The Rule of 40, growth rate plus profit margin, tells you whether the market will fund it. Treat these as permissions, not targets. Pull ICP evidence from recorded sales calls rather than keyword tools, then map it with question research for AI search.
What is a good net revenue retention benchmark for B2B SaaS?
Median net revenue retention (NRR) for bootstrapped B2B SaaS companies between $3M and $20M ARR is 103%, with the 90th percentile at 117.9%. Median gross revenue retention (GRR) is 91%. Median growth for that cohort is 15%, rising to 42.3% at the 90th percentile. The distinction matters. NRR measures revenue kept plus expansion from existing accounts. GRR strips expansion out, so it shows pure leakage. The elasticity is what makes retention a growth lever rather than a customer-success metric: • Moving NRR from the 90% to 100% band into the 100% to 110% band adds roughly five points of growth. • The highest-NRR cohort grows about 173% above median. If your GRR is materially below 91% and feature requests feel chaotic, the acquisition filter is broken, not the backlog. Customers who misunderstood your value chose you for the wrong reasons, then try to reshape the product into what they thought they bought. That is why MaximusLabs AI starts engagements with positioning sessions alongside leadership rather than a keyword map. The framing is captured through our Founder's Voice methodology and then reflected consistently across every surface a buyer checks.
Why has product-led growth hit a ceiling, and what replaces it?
Pure product-led growth (PLG) stalls because self-serve cannot close enterprise buyers. Those deals need security review, procurement, legal sign-off, and a named human on the other side. No onboarding flow handles a multi-department approval. The structural proof is older than PLG itself. Meta wanted completely self-serve automated ads and still built a large account management team, because the revenue concentrates in big accounts and those accounts need someone to talk to. What replaces pure PLG is a hybrid motion. PLG keeps acquisition and activation, then qualified usage routes into sales: • Define a product-qualified lead on behaviour, not firmographics. Seats added, a feature used twice, an API key generated. • Score accounts rather than users. Three activated users at one domain is a signal. • Route to a named owner within 24 hours, with usage context attached. • Keep self-serve open above the sales threshold. • Measure both paths separately, because blended conversion hides which one is broken. Add the sales layer when deal size, not deal volume, becomes the constraint. For the search side of that motion, see our B2B SaaS AEO strategies.
Is SEO still worth it for SaaS now that AI Overviews exist?
Yes, but the payoff moved from clicks to citations. Pew Research tracked 68,879 Google searches and found clicks on traditional results fall from 15% to 8% when an AI summary appears. Links inside the summary are clicked in just 1% of visits, and about 26% of those sessions end entirely. Position-one click-through rate drops around 34.5% on informational queries carrying an AI Overview, and operators running mature programs report 20% to 40% organic declines depending on industry. The traffic that survives is worth more. AI search visitors convert at roughly 4.4 times the value of traditional organic visitors, so volume reporting understates the channel twice over. What changed in practice: • AI engines return 5 to 15 names, and that shortlist becomes the buyer's evaluation set. • 88% of AI summaries cite three or more sources, so shortlist membership is contested query by query. • Ranking a blue link is no longer the job. Becoming the cited answer is. MaximusLabs AI measures this as shortlist appearance rate across thousands of question variants, not single rankings. The mechanics are documented in our guide to AEO versus SEO differences.
How do I measure AI-driven growth when GA4 reports everything as Direct?
Most AI search influence never appears as a referral, because the citation is read rather than clicked. With in-summary links clicked in only 1% of visits, GA4 files that influence under Direct or Branded Search. Three instruments close the gap, in this order: • A self-reported attribution field at signup or checkout, asking how the buyer heard about you. This captures roughly 90% of the influence GA4 misfiles. • Custom GA4 channel groups for chatgpt.com, perplexity.ai, gemini.google.com, and copilot.microsoft.com, defined by hostname. • A 30-question prompt-set audit, re-run monthly, logging shortlist appearance and which sources were cited instead of you. Report three numbers to the board: shortlist appearance rate, assisted pipeline, and revenue per AI-sourced visit. Be sceptical of tooling. Dozens of AEO rank trackers charge hundreds to thousands of dollars monthly for the same API pinging, and Ahrefs or Semrush will likely bundle it. Knowing what you rank does not cause an outcome. MaximusLabs AI runs visibility tracking daily, regression-tests it, and ties results to pipeline rather than mentions. Our full approach to GEO revenue attribution explains the model.
Should we build documentation or win G2 and Reddit for AI visibility?
Both, split by query type. Query shape decides which surface wins. • Long-tail how-to queries like "how to integrate X with Y" are won by owned docs, feature pages, and API references. • Head category queries like "best CRM software" are dominated by third parties. Roughly 85% of brand mentions come from external sources, and the G2, Capterra, Software Advice, and GetApp family controls about 84% of B2B review citations. • Comparison queries need both an owned versus page and third-party reviews behind it. The evidence favors earned signals more than most teams expect. Brand web mentions, linked and unlinked, correlate with AI Overview visibility at a Spearman coefficient of 0.664, against 0.218 for backlinks, roughly three times stronger. Wikipedia, YouTube, and Reddit together appear in about 15% of AI summaries. Technical documentation still earns citations at 34% to 41%, against 15% to 18% for blog posts, so the owned track is not optional either. MaximusLabs AI runs both pillars: Owned AEO, where your content becomes the answer, and Earned AEO, where reviews, Reddit, press, and listicles make engines trust you. Start with our guide to Reddit and forum AEO.